29
/
en
AIzaSyAYiBZKx7MnpbEhh9jyipgxe19OcubqV5w
April 1, 2024
50806
Middle income
MIC
false
2
1
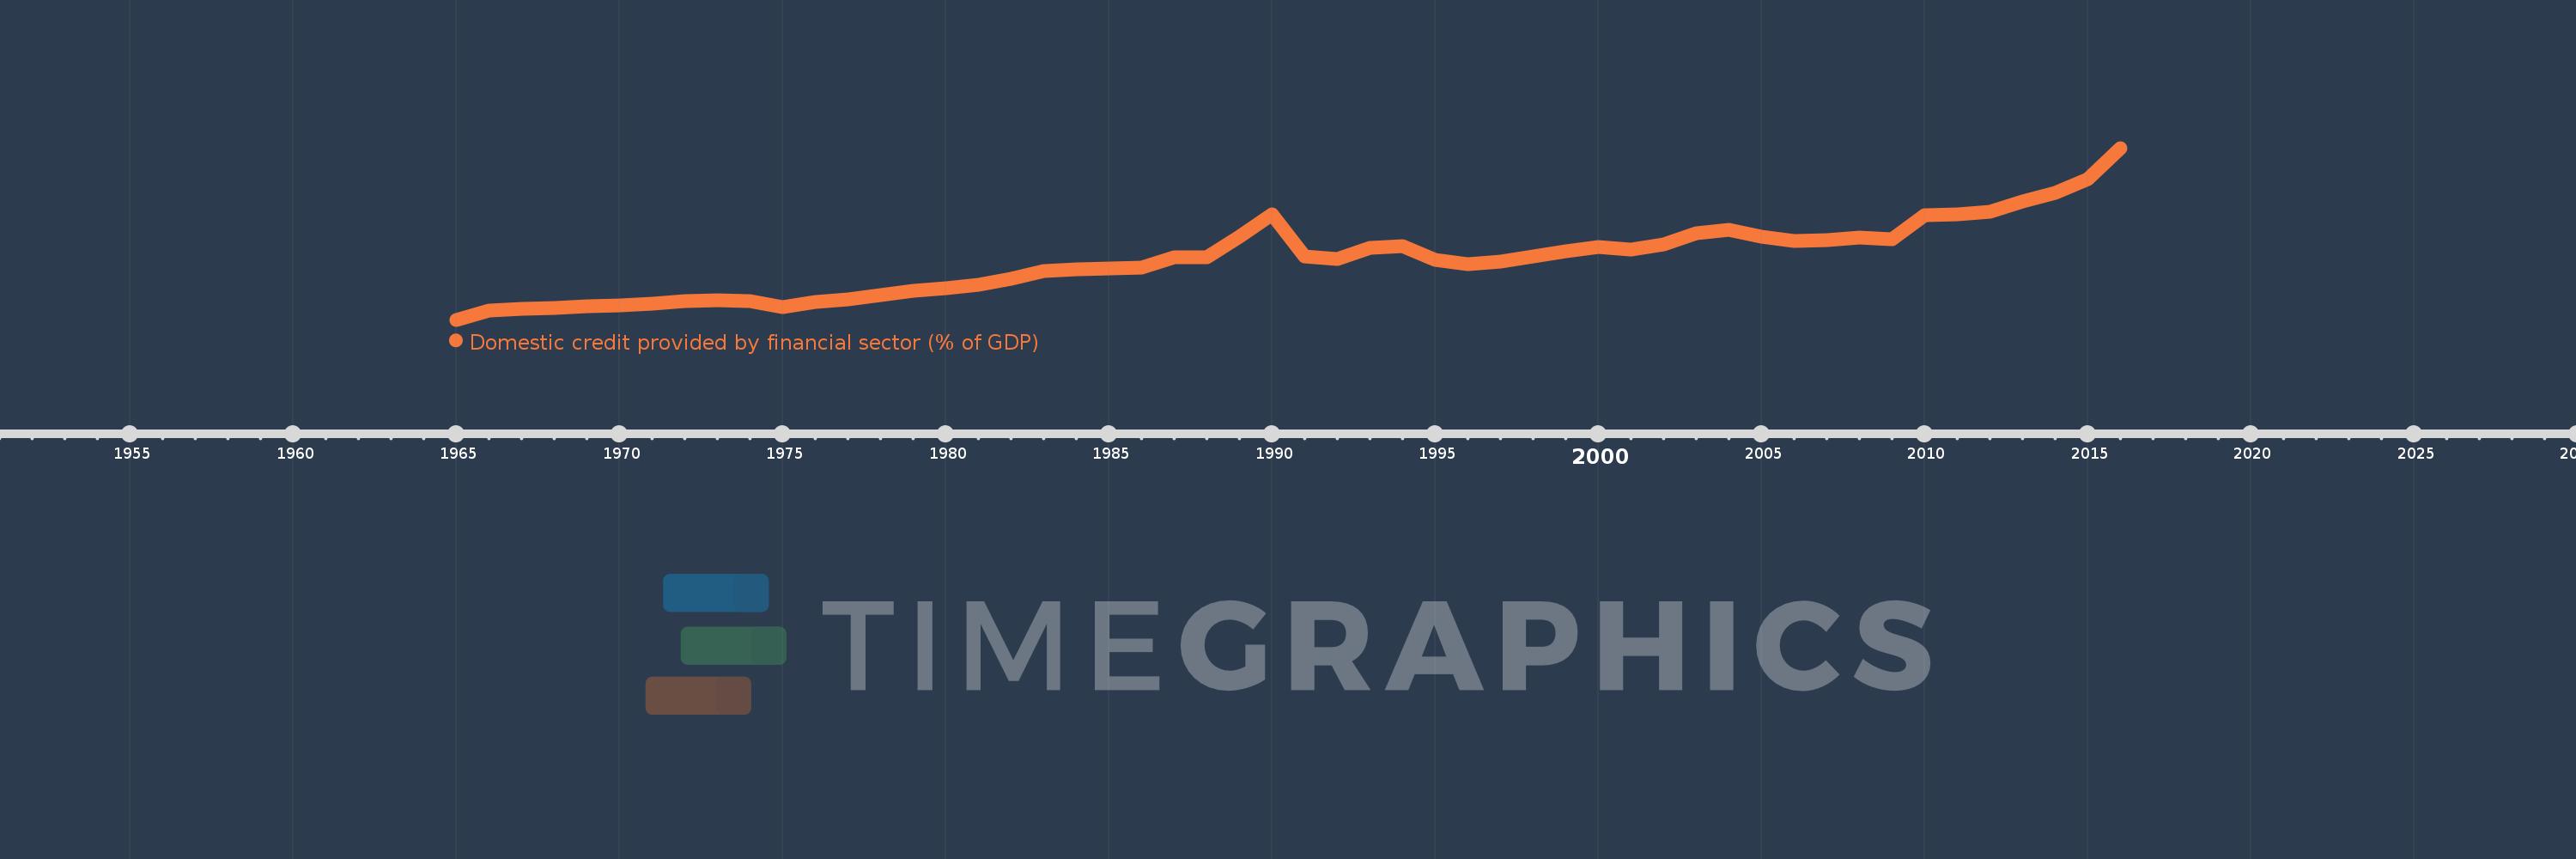
Domestic credit provided by financial sector (% of GDP)
2016,2015,2014,2013,2012,2011,2010,2009,2008,2007,2006,2005,2004,2003,2002,2001,2000,1999,1998,1997,1996,1995,1994,1993,1992,1991,1990,1989,1988,1987,1986,1985,1984,1983,1982,1981,1980,1979,1978,1977,1976,1975,1974,1973,1972,1971,1970,1969,1968,1967,1966,1965
This statistics in other country:
AfghanistanAlbaniaAlgeriaAngolaAntigua and BarbudaArab WorldArgentinaArmeniaArubaAustraliaAustriaAzerbaijanBahamas, TheBahrainBangladeshBarbadosBelarusBelgiumBelizeBeninBhutanBoliviaBosnia and HerzegovinaBotswanaBrazilBrunei DarussalamBulgariaBurkina FasoBurundiCabo VerdeCambodiaCameroonCanadaCaribbean small statesCentral African RepublicCentral Europe and the BalticsChadChileChinaColombiaComorosCongo, Dem. Rep.Congo, Rep.Costa RicaCote d'IvoireCroatiaCyprusCzech RepublicDenmarkDjiboutiDominicaDominican RepublicEarly-demographic dividendEast Asia & PacificEast Asia & Pacific (excluding high income)East Asia & Pacific (IDA & IBRD countries)EcuadorEgypt, Arab Rep.El SalvadorEquatorial GuineaEritreaEstoniaEthiopiaEuro areaEurope & Central AsiaEurope & Central Asia (excluding high income)Europe & Central Asia (IDA & IBRD countries)European UnionFijiFinlandFragile and conflict affected situationsFranceGabonGambia, TheGeorgiaGermanyGhanaGreeceGrenadaGuatemalaGuineaGuinea-BissauGuyanaHaitiHeavily indebted poor countries (HIPC)High incomeHondurasHong Kong SAR, ChinaHungaryIBRD onlyIcelandIDA & IBRD totalIDA blendIDA onlyIDA totalIndiaIndonesiaIran, Islamic Rep.IraqIrelandIsraelItalyJamaicaJapanJordanKazakhstanKenyaKorea, Rep.KosovoKuwaitKyrgyz RepublicLao PDRLate-demographic dividendLatin America & Caribbean Latin America & Caribbean (excluding high income)Latin America & the Caribbean (IDA & IBRD countries)LatviaLeast developed countries: UN classificationLebanonLesothoLiberiaLibyaLithuaniaLow & middle incomeLow incomeLower middle incomeLuxembourgMacao SAR, ChinaMacedonia, FYRMadagascarMalawiMalaysiaMaldivesMaliMaltaMauritaniaMauritiusMexicoMicronesia, Fed. Sts.Middle East & North AfricaMiddle East & North Africa (excluding high income)Middle East & North Africa (IDA & IBRD countries)Middle incomeMoldovaMongoliaMontenegroMoroccoMozambiqueMyanmarNamibiaNepalNetherlandsNew ZealandNicaraguaNigerNigeriaNorth AmericaNorwayOECD membersOmanOther small statesPacific island small statesPakistanPanamaPapua New GuineaParaguayPeruPhilippinesPolandPortugalPost-demographic dividendPre-demographic dividendQatarRomaniaRussian FederationRwandaSamoaSao Tome and PrincipeSaudi ArabiaSenegalSerbiaSeychellesSierra LeoneSingaporeSlovak RepublicSloveniaSmall statesSolomon IslandsSouth AfricaSouth AsiaSouth Asia (IDA & IBRD)South SudanSpainSri LankaSt. Kitts and NevisSt. LuciaSt. Vincent and the GrenadinesSub-Saharan Africa Sub-Saharan Africa (excluding high income)Sub-Saharan Africa (IDA & IBRD countries)SudanSurinameSwazilandSwedenSwitzerlandSyrian Arab RepublicTajikistanTanzaniaThailandTimor-LesteTogoTongaTrinidad and TobagoTunisiaTurkeyUgandaUkraineUnited Arab EmiratesUnited KingdomUnited StatesUpper middle incomeUruguayVanuatuVenezuela, RBVietnamWest Bank and GazaWorldYemen, Rep.ZambiaZimbabwe Timeline:
This timeline shows a graph from 1965 to 2016 of Middle income. No data until 1964. Number of actual observations by date: 52.
Source name:
World Development Indicators
Source organization:
International Monetary Fund, International Financial Statistics and data files, and World Bank and OECD GDP estimates.
Categories, topics:
Financial Sector
Last updated:
apr 23, 2017
Indicators value changes by year
Minimum:
22.918
jan 1, 1965
Maximum:
125.966
jan 1, 2016
At the date of observation
Value
Absolute change
Change from previous value
jan 1, 1965
22.918
+22.918
0.0%
jan 1, 1966
28.473
+5.555
24.24%
jan 1, 1967
29.322
+0.85
2.98%
jan 1, 1968
30.194
+0.871
2.97%
jan 1, 1969
31.187
+0.994
3.29%
jan 1, 1970
31.709
+0.522
1.67%
jan 1, 1971
32.606
+0.896
2.83%
jan 1, 1972
34.222
+1.616
4.96%
jan 1, 1973
34.516
+0.294
0.86%
jan 1, 1974
33.912
-0.604
-1.75%
jan 1, 1975
30.288
-3.624
-10.69%
jan 1, 1976
33.826
+3.538
11.68%
jan 1, 1977
35.356
+1.53
4.52%
jan 1, 1978
37.658
+2.302
6.51%
jan 1, 1979
40.268
+2.61
6.93%
jan 1, 1980
41.824
+1.556
3.86%
jan 1, 1981
43.646
+1.822
4.36%
jan 1, 1982
47.584
+3.937
9.02%
jan 1, 1983
52.056
+4.472
9.4%
jan 1, 1984
53.159
+1.104
2.12%
jan 1, 1985
53.574
+0.415
0.78%
jan 1, 1986
54.05
+0.475
0.89%
jan 1, 1987
60.144
+6.095
11.28%
jan 1, 1988
60.178
+0.033
0.06%
jan 1, 1989
72.793
+12.616
20.96%
jan 1, 1990
86.24
+13.447
18.47%
jan 1, 1991
60.942
-25.298
-29.33%
jan 1, 1992
59.271
-1.671
-2.74%
jan 1, 1993
66.208
+6.937
11.7%
jan 1, 1994
66.827
+0.618
0.93%
jan 1, 1995
58.621
-8.206
-12.28%
jan 1, 1996
56.153
-2.467
-4.21%
jan 1, 1997
57.891
+1.737
3.09%
jan 1, 1998
60.716
+2.825
4.88%
jan 1, 1999
64.155
+3.439
5.66%
jan 1, 2000
66.683
+2.528
3.94%
jan 1, 2001
65.141
-1.542
-2.31%
jan 1, 2002
67.929
+2.788
4.28%
jan 1, 2003
74.729
+6.8
10.01%
jan 1, 2004
77.041
+2.312
3.09%
jan 1, 2005
72.781
-4.261
-5.53%
jan 1, 2006
70.327
-2.454
-3.37%
jan 1, 2007
70.854
+0.527
0.75%
jan 1, 2008
72.005
+1.15
1.62%
jan 1, 2009
70.951
-1.053
-1.46%
jan 1, 2010
85.786
+14.835
20.91%
jan 1, 2011
86.296
+0.51
0.59%
jan 1, 2012
87.463
+1.167
1.35%
jan 1, 2013
93.727
+6.264
7.16%
jan 1, 2014
98.961
+5.234
5.58%
jan 1, 2015
107.232
+8.271
8.36%
jan 1, 2016
125.966
+18.734
17.47%
Ranking of countries by current statistics by years


Comments: