29
/
en
AIzaSyAYiBZKx7MnpbEhh9jyipgxe19OcubqV5w
April 1, 2024
35640
High income
HIC
false
2
1
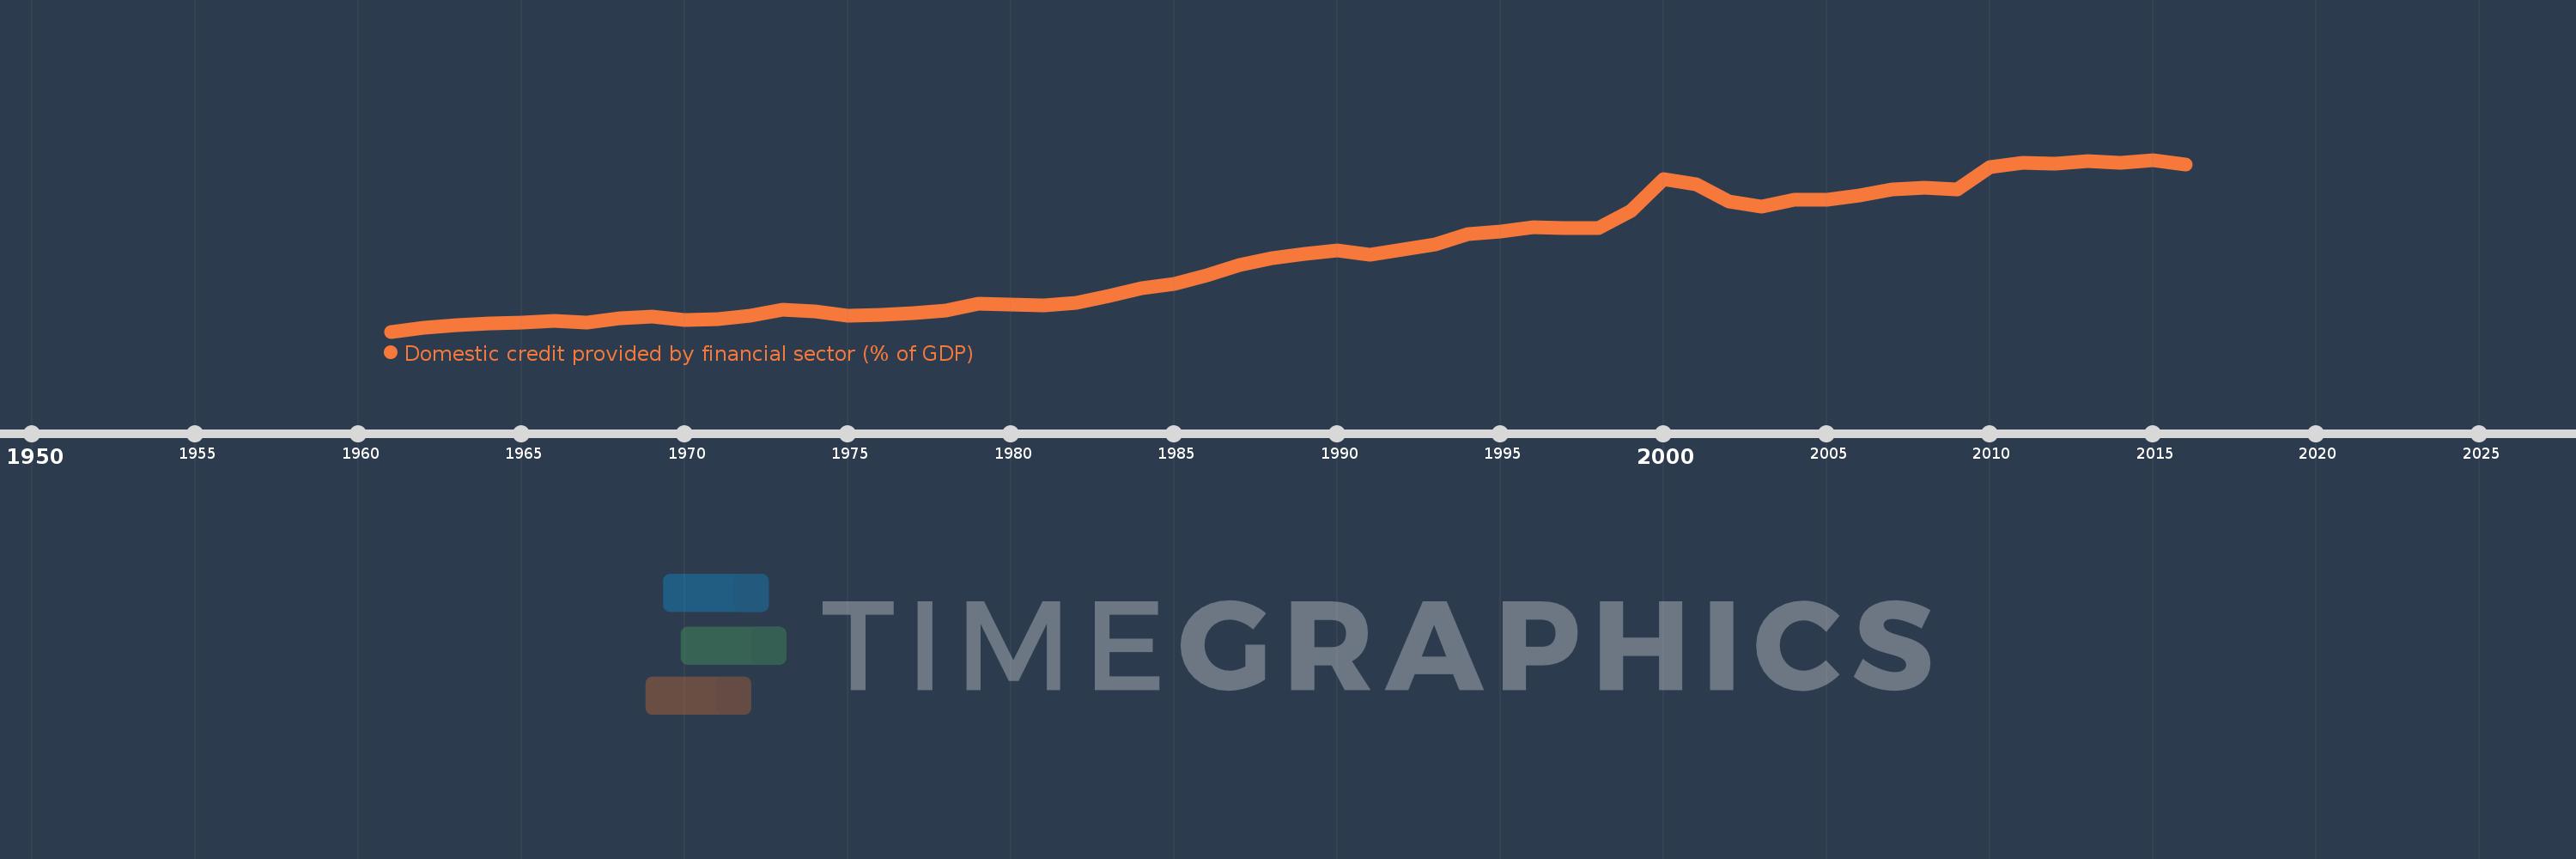
Domestic credit provided by financial sector (% of GDP)
2016,2015,2014,2013,2012,2011,2010,2009,2008,2007,2006,2005,2004,2003,2002,2001,2000,1999,1998,1997,1996,1995,1994,1993,1992,1991,1990,1989,1988,1987,1986,1985,1984,1983,1982,1981,1980,1979,1978,1977,1976,1975,1974,1973,1972,1971,1970,1969,1968,1967,1966,1965,1964,1963,1962,1961
This statistics in other country:
AfghanistanAlbaniaAlgeriaAngolaAntigua and BarbudaArab WorldArgentinaArmeniaArubaAustraliaAustriaAzerbaijanBahamas, TheBahrainBangladeshBarbadosBelarusBelgiumBelizeBeninBhutanBoliviaBosnia and HerzegovinaBotswanaBrazilBrunei DarussalamBulgariaBurkina FasoBurundiCabo VerdeCambodiaCameroonCanadaCaribbean small statesCentral African RepublicCentral Europe and the BalticsChadChileChinaColombiaComorosCongo, Dem. Rep.Congo, Rep.Costa RicaCote d'IvoireCroatiaCyprusCzech RepublicDenmarkDjiboutiDominicaDominican RepublicEarly-demographic dividendEast Asia & PacificEast Asia & Pacific (excluding high income)East Asia & Pacific (IDA & IBRD countries)EcuadorEgypt, Arab Rep.El SalvadorEquatorial GuineaEritreaEstoniaEthiopiaEuro areaEurope & Central AsiaEurope & Central Asia (excluding high income)Europe & Central Asia (IDA & IBRD countries)European UnionFijiFinlandFragile and conflict affected situationsFranceGabonGambia, TheGeorgiaGermanyGhanaGreeceGrenadaGuatemalaGuineaGuinea-BissauGuyanaHaitiHeavily indebted poor countries (HIPC)High incomeHondurasHong Kong SAR, ChinaHungaryIBRD onlyIcelandIDA & IBRD totalIDA blendIDA onlyIDA totalIndiaIndonesiaIran, Islamic Rep.IraqIrelandIsraelItalyJamaicaJapanJordanKazakhstanKenyaKorea, Rep.KosovoKuwaitKyrgyz RepublicLao PDRLate-demographic dividendLatin America & Caribbean Latin America & Caribbean (excluding high income)Latin America & the Caribbean (IDA & IBRD countries)LatviaLeast developed countries: UN classificationLebanonLesothoLiberiaLibyaLithuaniaLow & middle incomeLow incomeLower middle incomeLuxembourgMacao SAR, ChinaMacedonia, FYRMadagascarMalawiMalaysiaMaldivesMaliMaltaMauritaniaMauritiusMexicoMicronesia, Fed. Sts.Middle East & North AfricaMiddle East & North Africa (excluding high income)Middle East & North Africa (IDA & IBRD countries)Middle incomeMoldovaMongoliaMontenegroMoroccoMozambiqueMyanmarNamibiaNepalNetherlandsNew ZealandNicaraguaNigerNigeriaNorth AmericaNorwayOECD membersOmanOther small statesPacific island small statesPakistanPanamaPapua New GuineaParaguayPeruPhilippinesPolandPortugalPost-demographic dividendPre-demographic dividendQatarRomaniaRussian FederationRwandaSamoaSao Tome and PrincipeSaudi ArabiaSenegalSerbiaSeychellesSierra LeoneSingaporeSlovak RepublicSloveniaSmall statesSolomon IslandsSouth AfricaSouth AsiaSouth Asia (IDA & IBRD)South SudanSpainSri LankaSt. Kitts and NevisSt. LuciaSt. Vincent and the GrenadinesSub-Saharan Africa Sub-Saharan Africa (excluding high income)Sub-Saharan Africa (IDA & IBRD countries)SudanSurinameSwazilandSwedenSwitzerlandSyrian Arab RepublicTajikistanTanzaniaThailandTimor-LesteTogoTongaTrinidad and TobagoTunisiaTurkeyUgandaUkraineUnited Arab EmiratesUnited KingdomUnited StatesUpper middle incomeUruguayVanuatuVenezuela, RBVietnamWest Bank and GazaWorldYemen, Rep.ZambiaZimbabwe Timeline:
This timeline shows a graph from 1961 to 2016 of High income. No data until 1960. Number of actual observations by date: 56.
Source name:
World Development Indicators
Source organization:
International Monetary Fund, International Financial Statistics and data files, and World Bank and OECD GDP estimates.
Categories, topics:
Financial Sector
Last updated:
apr 23, 2017
Indicators value changes by year
Minimum:
78.113
jan 1, 1961
Maximum:
208.67
jan 1, 2015
At the date of observation
Value
Absolute change
Change from previous value
jan 1, 1961
78.113
+78.113
0.0%
jan 1, 1962
80.895
+2.782
3.56%
jan 1, 1963
82.855
+1.959
2.42%
jan 1, 1964
84.289
+1.434
1.73%
jan 1, 1965
85.003
+0.714
0.85%
jan 1, 1966
86.516
+1.514
1.78%
jan 1, 1967
84.804
-1.713
-1.98%
jan 1, 1968
88.068
+3.264
3.85%
jan 1, 1969
89.218
+1.15
1.31%
jan 1, 1970
86.901
-2.317
-2.6%
jan 1, 1971
87.807
+0.906
1.04%
jan 1, 1972
90.393
+2.586
2.94%
jan 1, 1973
94.955
+4.561
5.05%
jan 1, 1974
93.325
-1.629
-1.72%
jan 1, 1975
89.982
-3.344
-3.58%
jan 1, 1976
90.946
+0.964
1.07%
jan 1, 1977
92.071
+1.125
1.24%
jan 1, 1978
93.856
+1.785
1.94%
jan 1, 1979
99.472
+5.617
5.98%
jan 1, 1980
98.403
-1.07
-1.08%
jan 1, 1981
97.925
-0.477
-0.49%
jan 1, 1982
100.235
+2.31
2.36%
jan 1, 1983
105.088
+4.853
4.84%
jan 1, 1984
110.901
+5.813
5.53%
jan 1, 1985
114.615
+3.714
3.35%
jan 1, 1986
120.832
+6.217
5.42%
jan 1, 1987
128.7
+7.869
6.51%
jan 1, 1988
133.642
+4.942
3.84%
jan 1, 1989
137.391
+3.749
2.8%
jan 1, 1990
140.115
+2.724
1.98%
jan 1, 1991
136.703
-3.411
-2.43%
jan 1, 1992
140.468
+3.765
2.75%
jan 1, 1993
144.087
+3.619
2.58%
jan 1, 1994
152.433
+8.347
5.79%
jan 1, 1995
154.477
+2.043
1.34%
jan 1, 1996
157.352
+2.876
1.86%
jan 1, 1997
156.787
-0.565
-0.36%
jan 1, 1998
157.036
+0.249
0.16%
jan 1, 1999
169.964
+12.928
8.23%
jan 1, 2000
193.992
+24.028
14.14%
jan 1, 2001
190.341
-3.651
-1.88%
jan 1, 2002
177.228
-13.113
-6.89%
jan 1, 2003
173.415
-3.813
-2.15%
jan 1, 2004
178.119
+4.705
2.71%
jan 1, 2005
178.452
+0.333
0.19%
jan 1, 2006
181.86
+3.408
1.91%
jan 1, 2007
186.02
+4.16
2.29%
jan 1, 2008
187.466
+1.446
0.78%
jan 1, 2009
186.253
-1.213
-0.65%
jan 1, 2010
202.987
+16.734
8.98%
jan 1, 2011
206.078
+3.091
1.52%
jan 1, 2012
205.644
-0.434
-0.21%
jan 1, 2013
207.741
+2.097
1.02%
jan 1, 2014
206.448
-1.292
-0.62%
jan 1, 2015
208.67
+2.222
1.08%
jan 1, 2016
205.07
-3.6
-1.73%
Ranking of countries by current statistics by years


Comments: