29
/
en
AIzaSyAYiBZKx7MnpbEhh9jyipgxe19OcubqV5w
April 1, 2024
254000
Suriname
SUR
true
2
1
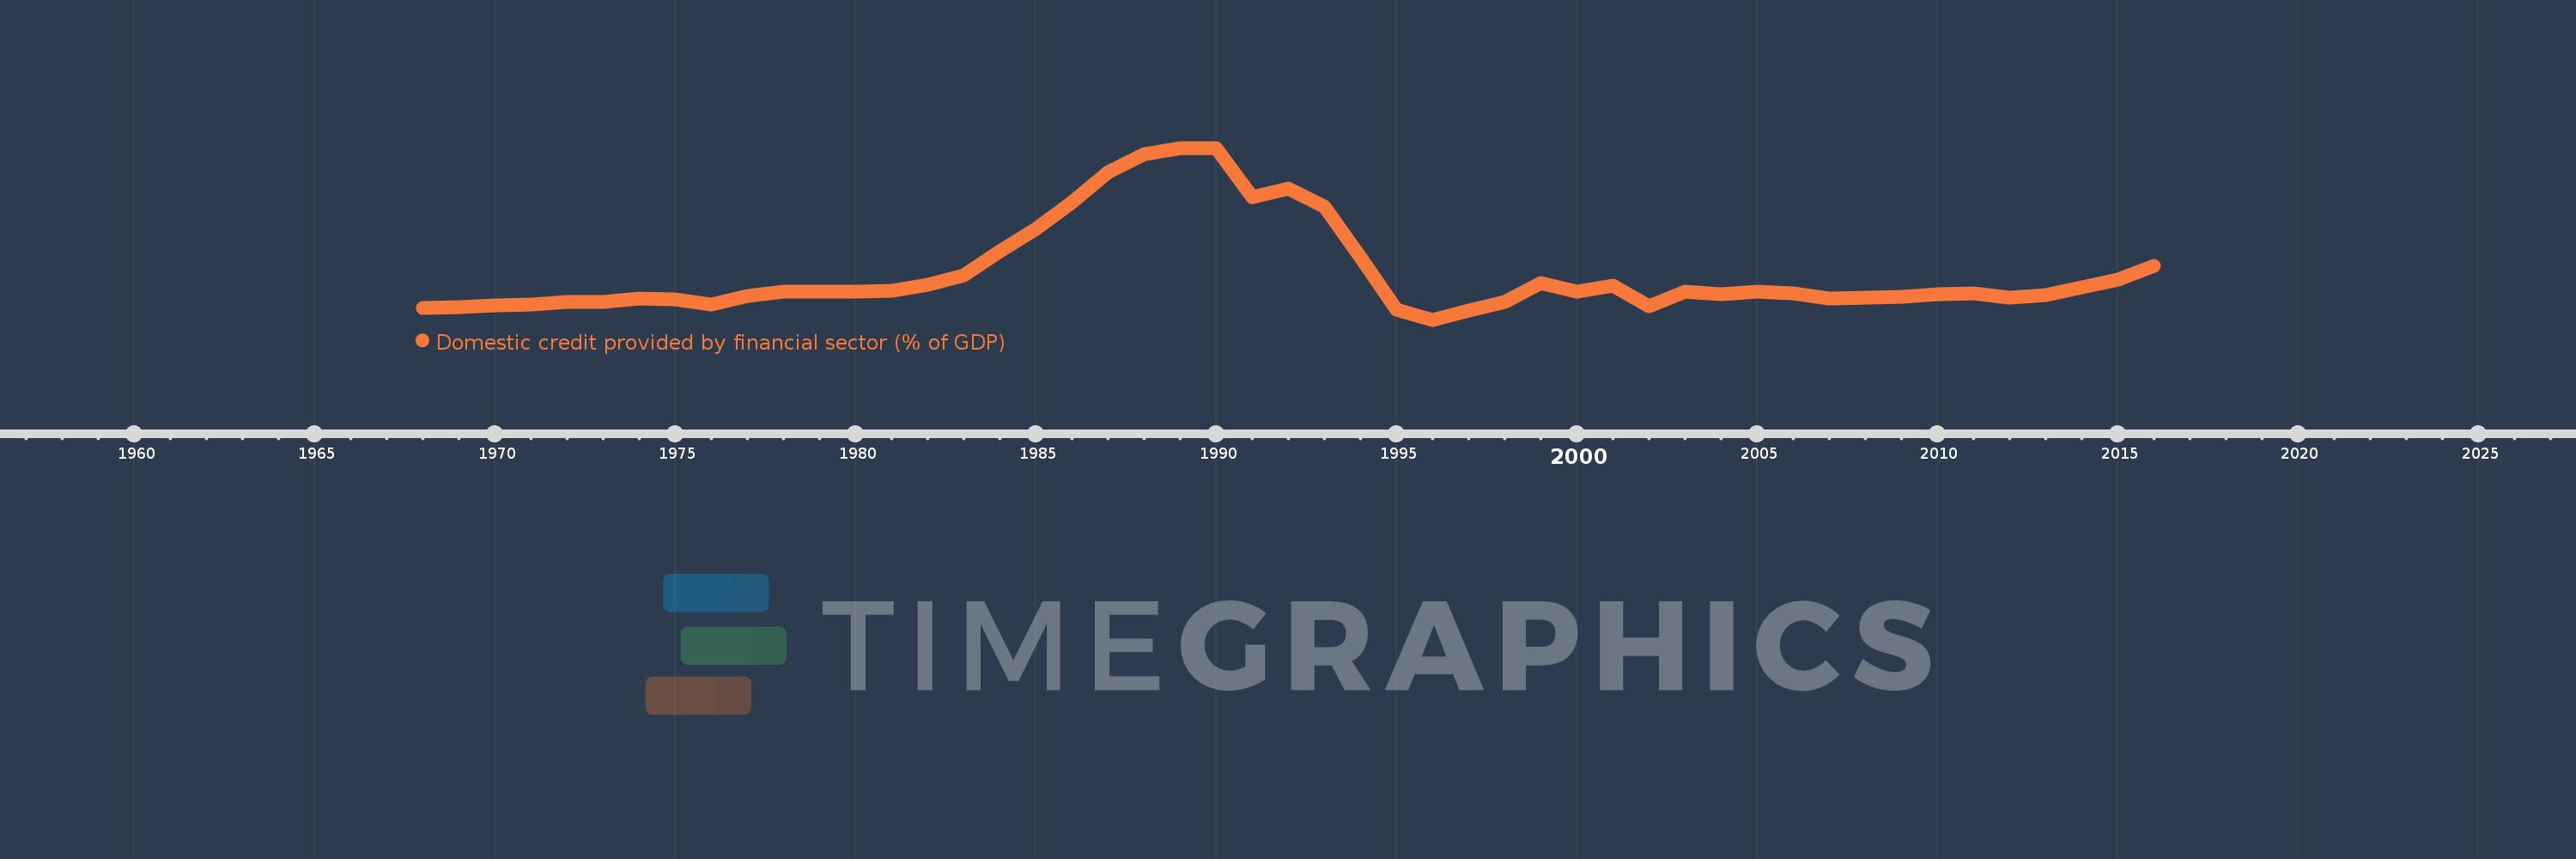
Domestic credit provided by financial sector (% of GDP)
2016,2015,2014,2013,2012,2011,2010,2009,2008,2007,2006,2005,2004,2003,2002,2001,2000,1999,1998,1997,1996,1995,1994,1993,1992,1991,1990,1989,1988,1987,1986,1985,1984,1983,1982,1981,1980,1979,1978,1977,1976,1975,1974,1973,1972,1971,1970,1969,1968
This statistics in other country:
AfghanistanAlbaniaAlgeriaAngolaAntigua and BarbudaArab WorldArgentinaArmeniaArubaAustraliaAustriaAzerbaijanBahamas, TheBahrainBangladeshBarbadosBelarusBelgiumBelizeBeninBhutanBoliviaBosnia and HerzegovinaBotswanaBrazilBrunei DarussalamBulgariaBurkina FasoBurundiCabo VerdeCambodiaCameroonCanadaCaribbean small statesCentral African RepublicCentral Europe and the BalticsChadChileChinaColombiaComorosCongo, Dem. Rep.Congo, Rep.Costa RicaCote d'IvoireCroatiaCyprusCzech RepublicDenmarkDjiboutiDominicaDominican RepublicEarly-demographic dividendEast Asia & PacificEast Asia & Pacific (excluding high income)East Asia & Pacific (IDA & IBRD countries)EcuadorEgypt, Arab Rep.El SalvadorEquatorial GuineaEritreaEstoniaEthiopiaEuro areaEurope & Central AsiaEurope & Central Asia (excluding high income)Europe & Central Asia (IDA & IBRD countries)European UnionFijiFinlandFragile and conflict affected situationsFranceGabonGambia, TheGeorgiaGermanyGhanaGreeceGrenadaGuatemalaGuineaGuinea-BissauGuyanaHaitiHeavily indebted poor countries (HIPC)High incomeHondurasHong Kong SAR, ChinaHungaryIBRD onlyIcelandIDA & IBRD totalIDA blendIDA onlyIDA totalIndiaIndonesiaIran, Islamic Rep.IraqIrelandIsraelItalyJamaicaJapanJordanKazakhstanKenyaKorea, Rep.KosovoKuwaitKyrgyz RepublicLao PDRLate-demographic dividendLatin America & Caribbean Latin America & Caribbean (excluding high income)Latin America & the Caribbean (IDA & IBRD countries)LatviaLeast developed countries: UN classificationLebanonLesothoLiberiaLibyaLithuaniaLow & middle incomeLow incomeLower middle incomeLuxembourgMacao SAR, ChinaMacedonia, FYRMadagascarMalawiMalaysiaMaldivesMaliMaltaMauritaniaMauritiusMexicoMicronesia, Fed. Sts.Middle East & North AfricaMiddle East & North Africa (excluding high income)Middle East & North Africa (IDA & IBRD countries)Middle incomeMoldovaMongoliaMontenegroMoroccoMozambiqueMyanmarNamibiaNepalNetherlandsNew ZealandNicaraguaNigerNigeriaNorth AmericaNorwayOECD membersOmanOther small statesPacific island small statesPakistanPanamaPapua New GuineaParaguayPeruPhilippinesPolandPortugalPost-demographic dividendPre-demographic dividendQatarRomaniaRussian FederationRwandaSamoaSao Tome and PrincipeSaudi ArabiaSenegalSerbiaSeychellesSierra LeoneSingaporeSlovak RepublicSloveniaSmall statesSolomon IslandsSouth AfricaSouth AsiaSouth Asia (IDA & IBRD)South SudanSpainSri LankaSt. Kitts and NevisSt. LuciaSt. Vincent and the GrenadinesSub-Saharan Africa Sub-Saharan Africa (excluding high income)Sub-Saharan Africa (IDA & IBRD countries)SudanSurinameSwazilandSwedenSwitzerlandSyrian Arab RepublicTajikistanTanzaniaThailandTimor-LesteTogoTongaTrinidad and TobagoTunisiaTurkeyUgandaUkraineUnited Arab EmiratesUnited KingdomUnited StatesUpper middle incomeUruguayVanuatuVenezuela, RBVietnamWest Bank and GazaWorldYemen, Rep.ZambiaZimbabwe Timeline:
This timeline shows a graph from 1968 to 2016 of Suriname. No data until 1967. Number of actual observations by date: 49.
Source name:
World Development Indicators
Source organization:
International Monetary Fund, International Financial Statistics and data files, and World Bank and OECD GDP estimates.
Categories, topics:
Financial Sector
Last updated:
apr 23, 2017
Indicators value changes by year
Maximum:
150.978
jan 1, 1990
At the date of observation
Value
Absolute change
Change from previous value
jan 1, 1968
14.724
+14.724
0.0%
jan 1, 1969
15.238
+0.514
3.49%
jan 1, 1970
16.809
+1.571
10.31%
jan 1, 1971
17.819
+1.01
6.01%
jan 1, 1972
19.636
+1.817
10.2%
jan 1, 1973
19.901
+0.265
1.35%
jan 1, 1974
23.105
+3.204
16.1%
jan 1, 1975
21.985
-1.121
-4.85%
jan 1, 1976
17.716
-4.268
-19.42%
jan 1, 1977
24.613
+6.897
38.93%
jan 1, 1978
28.384
+3.771
15.32%
jan 1, 1979
28.301
-0.083
-0.29%
jan 1, 1980
28.844
+0.543
1.92%
jan 1, 1981
29.552
+0.707
2.45%
jan 1, 1982
34.496
+4.944
16.73%
jan 1, 1983
42.534
+8.038
23.3%
jan 1, 1984
62.651
+20.117
47.3%
jan 1, 1985
81.974
+19.323
30.84%
jan 1, 1986
104.441
+22.467
27.41%
jan 1, 1987
130.001
+25.56
24.47%
jan 1, 1988
145.367
+15.367
11.82%
jan 1, 1989
150.803
+5.436
3.74%
jan 1, 1990
150.978
+0.175
0.12%
jan 1, 1991
109.183
-41.794
-27.68%
jan 1, 1992
116.646
+7.463
6.84%
jan 1, 1993
100.983
-15.663
-13.43%
jan 1, 1994
58.002
-42.981
-42.56%
jan 1, 1995
12.966
-45.036
-77.65%
jan 1, 1996
4.702
-8.264
-63.74%
jan 1, 1997
12.678
+7.977
169.66%
jan 1, 1998
20.09
+7.412
58.46%
jan 1, 1999
35.963
+15.873
79.01%
jan 1, 2000
28.565
-7.398
-20.57%
jan 1, 2001
33.656
+5.09
17.82%
jan 1, 2002
16.117
-17.539
-52.11%
jan 1, 2003
28.45
+12.333
76.52%
jan 1, 2004
26.59
-1.86
-6.54%
jan 1, 2005
28.563
+1.973
7.42%
jan 1, 2006
27.49
-1.073
-3.76%
jan 1, 2007
22.676
-4.814
-17.51%
jan 1, 2008
23.571
+0.895
3.95%
jan 1, 2009
23.912
+0.341
1.45%
jan 1, 2010
26.347
+2.435
10.18%
jan 1, 2011
26.906
+0.559
2.12%
jan 1, 2012
23.435
-3.471
-12.9%
jan 1, 2013
25.598
+2.163
9.23%
jan 1, 2014
32.523
+6.925
27.05%
jan 1, 2015
38.937
+6.414
19.72%
jan 1, 2016
50.55
+11.613
29.82%
Ranking of countries by current statistics by years


Comments: