29
/
en
AIzaSyAYiBZKx7MnpbEhh9jyipgxe19OcubqV5w
April 1, 2024
219482
Papua New Guinea
PNG
true
2
1
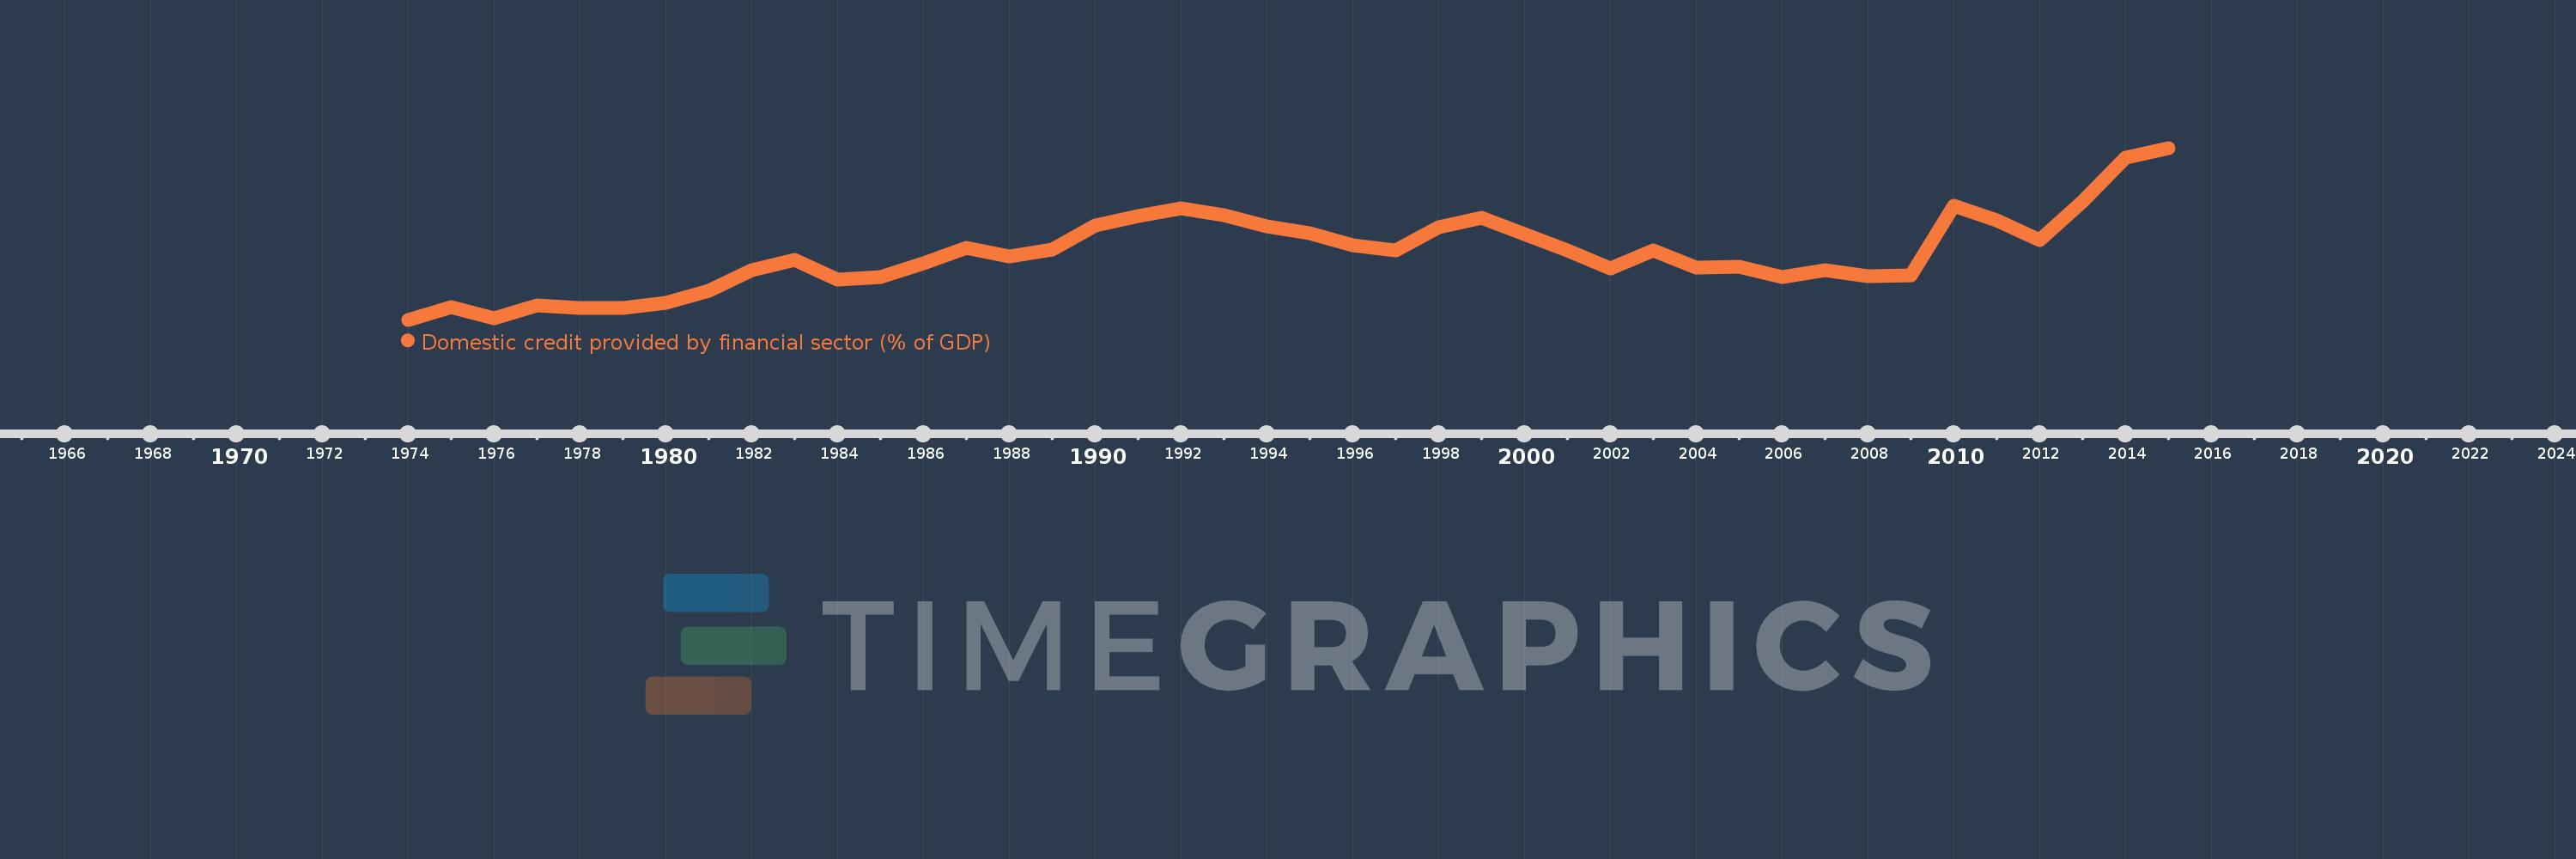
Domestic credit provided by financial sector (% of GDP)
2015,2014,2013,2012,2011,2010,2009,2008,2007,2006,2005,2004,2003,2002,2001,2000,1999,1998,1997,1996,1995,1994,1993,1992,1991,1990,1989,1988,1987,1986,1985,1984,1983,1982,1981,1980,1979,1978,1977,1976,1975,1974
This statistics in other country:
AfghanistanAlbaniaAlgeriaAngolaAntigua and BarbudaArab WorldArgentinaArmeniaArubaAustraliaAustriaAzerbaijanBahamas, TheBahrainBangladeshBarbadosBelarusBelgiumBelizeBeninBhutanBoliviaBosnia and HerzegovinaBotswanaBrazilBrunei DarussalamBulgariaBurkina FasoBurundiCabo VerdeCambodiaCameroonCanadaCaribbean small statesCentral African RepublicCentral Europe and the BalticsChadChileChinaColombiaComorosCongo, Dem. Rep.Congo, Rep.Costa RicaCote d'IvoireCroatiaCyprusCzech RepublicDenmarkDjiboutiDominicaDominican RepublicEarly-demographic dividendEast Asia & PacificEast Asia & Pacific (excluding high income)East Asia & Pacific (IDA & IBRD countries)EcuadorEgypt, Arab Rep.El SalvadorEquatorial GuineaEritreaEstoniaEthiopiaEuro areaEurope & Central AsiaEurope & Central Asia (excluding high income)Europe & Central Asia (IDA & IBRD countries)European UnionFijiFinlandFragile and conflict affected situationsFranceGabonGambia, TheGeorgiaGermanyGhanaGreeceGrenadaGuatemalaGuineaGuinea-BissauGuyanaHaitiHeavily indebted poor countries (HIPC)High incomeHondurasHong Kong SAR, ChinaHungaryIBRD onlyIcelandIDA & IBRD totalIDA blendIDA onlyIDA totalIndiaIndonesiaIran, Islamic Rep.IraqIrelandIsraelItalyJamaicaJapanJordanKazakhstanKenyaKorea, Rep.KosovoKuwaitKyrgyz RepublicLao PDRLate-demographic dividendLatin America & Caribbean Latin America & Caribbean (excluding high income)Latin America & the Caribbean (IDA & IBRD countries)LatviaLeast developed countries: UN classificationLebanonLesothoLiberiaLibyaLithuaniaLow & middle incomeLow incomeLower middle incomeLuxembourgMacao SAR, ChinaMacedonia, FYRMadagascarMalawiMalaysiaMaldivesMaliMaltaMauritaniaMauritiusMexicoMicronesia, Fed. Sts.Middle East & North AfricaMiddle East & North Africa (excluding high income)Middle East & North Africa (IDA & IBRD countries)Middle incomeMoldovaMongoliaMontenegroMoroccoMozambiqueMyanmarNamibiaNepalNetherlandsNew ZealandNicaraguaNigerNigeriaNorth AmericaNorwayOECD membersOmanOther small statesPacific island small statesPakistanPanamaPapua New GuineaParaguayPeruPhilippinesPolandPortugalPost-demographic dividendPre-demographic dividendQatarRomaniaRussian FederationRwandaSamoaSao Tome and PrincipeSaudi ArabiaSenegalSerbiaSeychellesSierra LeoneSingaporeSlovak RepublicSloveniaSmall statesSolomon IslandsSouth AfricaSouth AsiaSouth Asia (IDA & IBRD)South SudanSpainSri LankaSt. Kitts and NevisSt. LuciaSt. Vincent and the GrenadinesSub-Saharan Africa Sub-Saharan Africa (excluding high income)Sub-Saharan Africa (IDA & IBRD countries)SudanSurinameSwazilandSwedenSwitzerlandSyrian Arab RepublicTajikistanTanzaniaThailandTimor-LesteTogoTongaTrinidad and TobagoTunisiaTurkeyUgandaUkraineUnited Arab EmiratesUnited KingdomUnited StatesUpper middle incomeUruguayVanuatuVenezuela, RBVietnamWest Bank and GazaWorldYemen, Rep.ZambiaZimbabwe Timeline:
This timeline shows a graph from 1974 to 2015 of Papua New Guinea. No data until 1973. Number of actual observations by date: 42.
Source name:
World Development Indicators
Source organization:
International Monetary Fund, International Financial Statistics and data files, and World Bank and OECD GDP estimates.
Categories, topics:
Financial Sector
Last updated:
apr 23, 2017
Indicators value changes by year
Minimum:
12.636
jan 1, 1974
Maximum:
50.984
jan 1, 2015
At the date of observation
Value
Absolute change
Change from previous value
jan 1, 1974
12.636
+12.636
0.0%
jan 1, 1975
15.421
+2.785
22.04%
jan 1, 1976
12.937
-2.485
-16.11%
jan 1, 1977
15.798
+2.861
22.12%
jan 1, 1978
15.183
-0.615
-3.9%
jan 1, 1979
15.323
+0.141
0.93%
jan 1, 1980
16.368
+1.045
6.82%
jan 1, 1981
19.07
+2.702
16.51%
jan 1, 1982
23.672
+4.601
24.13%
jan 1, 1983
26.038
+2.367
10.0%
jan 1, 1984
21.602
-4.436
-17.04%
jan 1, 1985
22.136
+0.533
2.47%
jan 1, 1986
25.196
+3.06
13.83%
jan 1, 1987
28.705
+3.509
13.93%
jan 1, 1988
26.748
-1.957
-6.82%
jan 1, 1989
28.209
+1.461
5.46%
jan 1, 1990
33.591
+5.382
19.08%
jan 1, 1991
35.726
+2.134
6.35%
jan 1, 1992
37.573
+1.847
5.17%
jan 1, 1993
35.968
-1.604
-4.27%
jan 1, 1994
33.516
-2.452
-6.82%
jan 1, 1995
31.932
-1.584
-4.72%
jan 1, 1996
29.168
-2.765
-8.66%
jan 1, 1997
28.13
-1.037
-3.56%
jan 1, 1998
33.378
+5.247
18.65%
jan 1, 1999
35.317
+1.939
5.81%
jan 1, 2000
31.671
-3.645
-10.32%
jan 1, 2001
28.154
-3.518
-11.11%
jan 1, 2002
24.126
-4.028
-14.31%
jan 1, 2003
28.118
+3.993
16.55%
jan 1, 2004
24.235
-3.883
-13.81%
jan 1, 2005
24.441
+0.206
0.85%
jan 1, 2006
22.229
-2.213
-9.05%
jan 1, 2007
23.666
+1.438
6.47%
jan 1, 2008
22.447
-1.219
-5.15%
jan 1, 2009
22.592
+0.145
0.65%
jan 1, 2010
38.077
+15.485
68.54%
jan 1, 2011
34.762
-3.315
-8.71%
jan 1, 2012
30.426
-4.337
-12.48%
jan 1, 2013
38.994
+8.568
28.16%
jan 1, 2014
48.771
+9.778
25.07%
jan 1, 2015
50.984
+2.213
4.54%
Ranking of countries by current statistics by years


Comments: