29
/
en
AIzaSyAYiBZKx7MnpbEhh9jyipgxe19OcubqV5w
April 1, 2024
230905
Rwanda
RWA
true
2
1
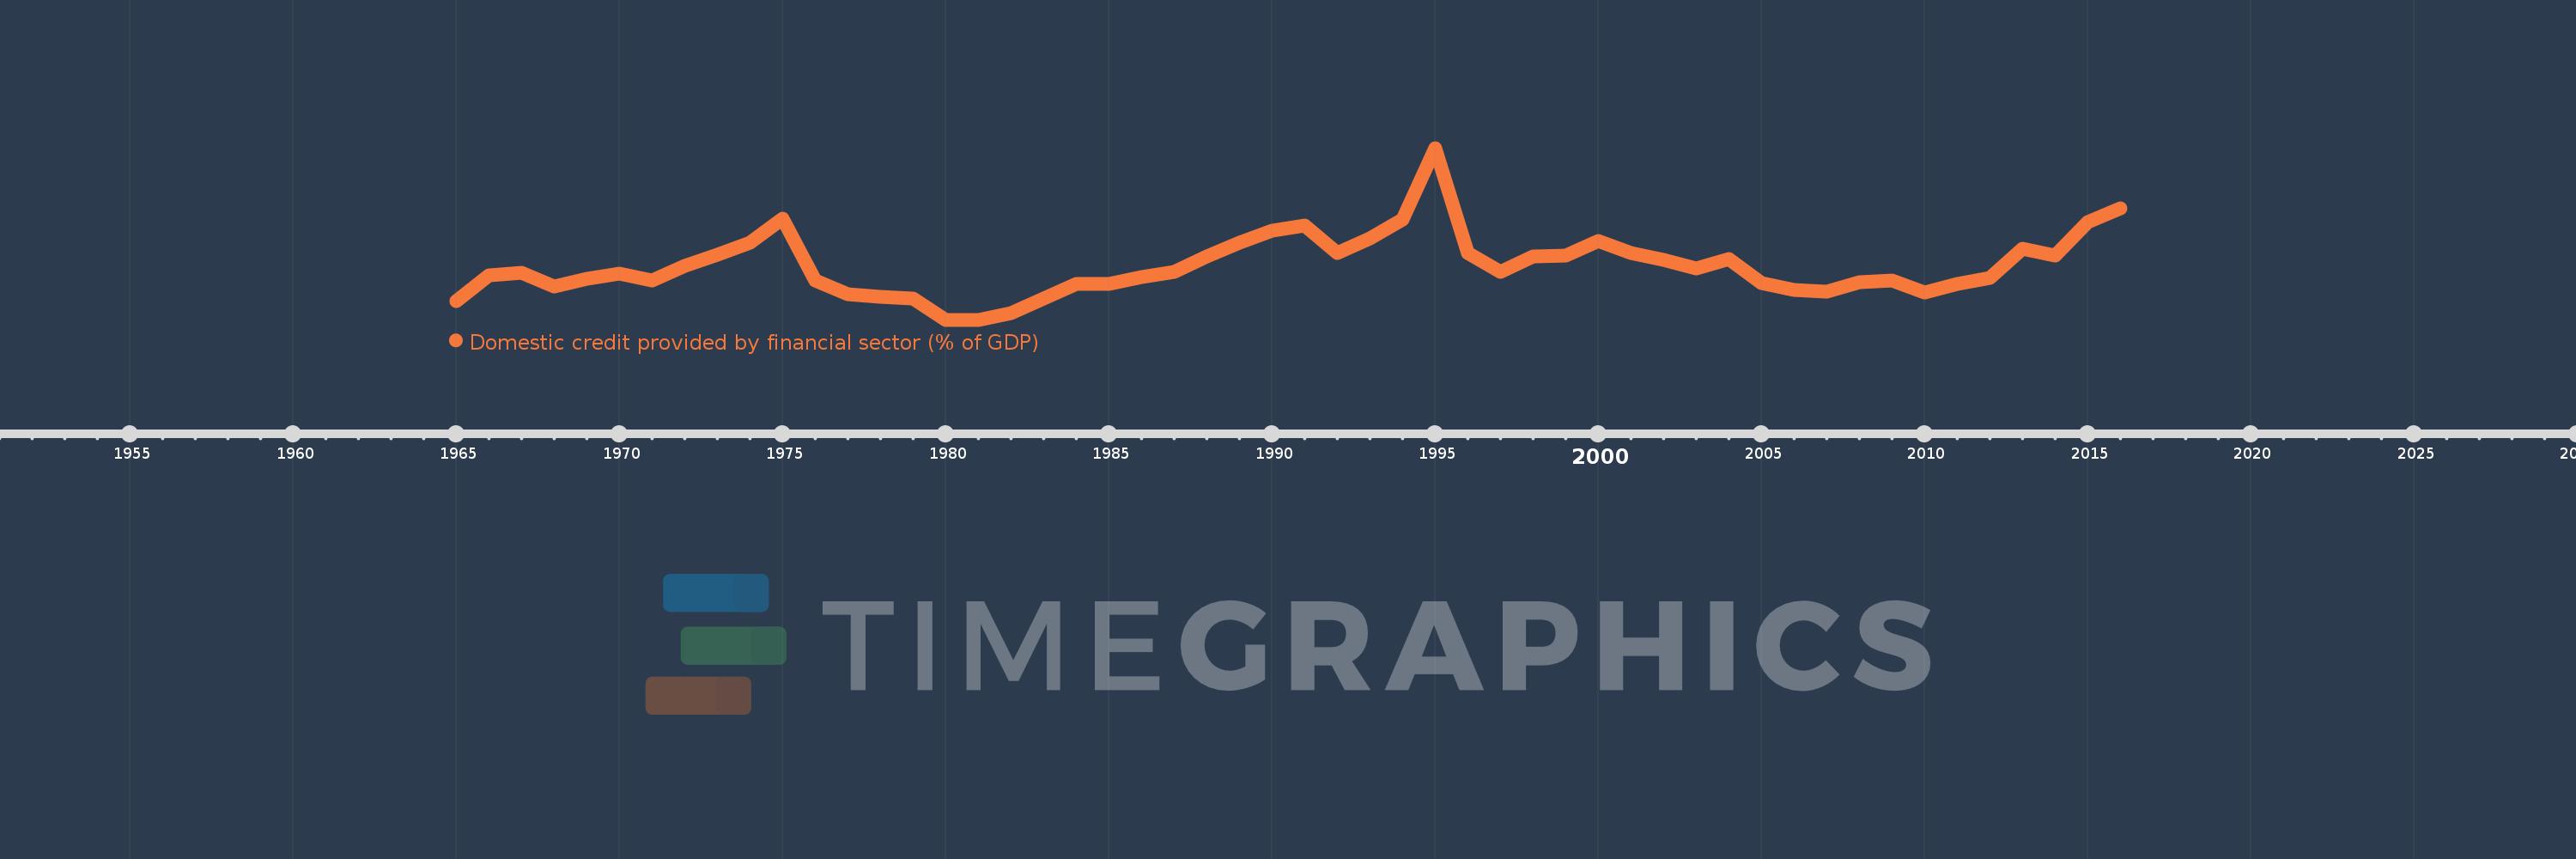
Domestic credit provided by financial sector (% of GDP)
2016,2015,2014,2013,2012,2011,2010,2009,2008,2007,2006,2005,2004,2003,2002,2001,2000,1999,1998,1997,1996,1995,1994,1993,1992,1991,1990,1989,1988,1987,1986,1985,1984,1983,1982,1981,1980,1979,1978,1977,1976,1975,1974,1973,1972,1971,1970,1969,1968,1967,1966,1965
This statistics in other country:
AfghanistanAlbaniaAlgeriaAngolaAntigua and BarbudaArab WorldArgentinaArmeniaArubaAustraliaAustriaAzerbaijanBahamas, TheBahrainBangladeshBarbadosBelarusBelgiumBelizeBeninBhutanBoliviaBosnia and HerzegovinaBotswanaBrazilBrunei DarussalamBulgariaBurkina FasoBurundiCabo VerdeCambodiaCameroonCanadaCaribbean small statesCentral African RepublicCentral Europe and the BalticsChadChileChinaColombiaComorosCongo, Dem. Rep.Congo, Rep.Costa RicaCote d'IvoireCroatiaCyprusCzech RepublicDenmarkDjiboutiDominicaDominican RepublicEarly-demographic dividendEast Asia & PacificEast Asia & Pacific (excluding high income)East Asia & Pacific (IDA & IBRD countries)EcuadorEgypt, Arab Rep.El SalvadorEquatorial GuineaEritreaEstoniaEthiopiaEuro areaEurope & Central AsiaEurope & Central Asia (excluding high income)Europe & Central Asia (IDA & IBRD countries)European UnionFijiFinlandFragile and conflict affected situationsFranceGabonGambia, TheGeorgiaGermanyGhanaGreeceGrenadaGuatemalaGuineaGuinea-BissauGuyanaHaitiHeavily indebted poor countries (HIPC)High incomeHondurasHong Kong SAR, ChinaHungaryIBRD onlyIcelandIDA & IBRD totalIDA blendIDA onlyIDA totalIndiaIndonesiaIran, Islamic Rep.IraqIrelandIsraelItalyJamaicaJapanJordanKazakhstanKenyaKorea, Rep.KosovoKuwaitKyrgyz RepublicLao PDRLate-demographic dividendLatin America & Caribbean Latin America & Caribbean (excluding high income)Latin America & the Caribbean (IDA & IBRD countries)LatviaLeast developed countries: UN classificationLebanonLesothoLiberiaLibyaLithuaniaLow & middle incomeLow incomeLower middle incomeLuxembourgMacao SAR, ChinaMacedonia, FYRMadagascarMalawiMalaysiaMaldivesMaliMaltaMauritaniaMauritiusMexicoMicronesia, Fed. Sts.Middle East & North AfricaMiddle East & North Africa (excluding high income)Middle East & North Africa (IDA & IBRD countries)Middle incomeMoldovaMongoliaMontenegroMoroccoMozambiqueMyanmarNamibiaNepalNetherlandsNew ZealandNicaraguaNigerNigeriaNorth AmericaNorwayOECD membersOmanOther small statesPacific island small statesPakistanPanamaPapua New GuineaParaguayPeruPhilippinesPolandPortugalPost-demographic dividendPre-demographic dividendQatarRomaniaRussian FederationRwandaSamoaSao Tome and PrincipeSaudi ArabiaSenegalSerbiaSeychellesSierra LeoneSingaporeSlovak RepublicSloveniaSmall statesSolomon IslandsSouth AfricaSouth AsiaSouth Asia (IDA & IBRD)South SudanSpainSri LankaSt. Kitts and NevisSt. LuciaSt. Vincent and the GrenadinesSub-Saharan Africa Sub-Saharan Africa (excluding high income)Sub-Saharan Africa (IDA & IBRD countries)SudanSurinameSwazilandSwedenSwitzerlandSyrian Arab RepublicTajikistanTanzaniaThailandTimor-LesteTogoTongaTrinidad and TobagoTunisiaTurkeyUgandaUkraineUnited Arab EmiratesUnited KingdomUnited StatesUpper middle incomeUruguayVanuatuVenezuela, RBVietnamWest Bank and GazaWorldYemen, Rep.ZambiaZimbabwe Timeline:
This timeline shows a graph from 1965 to 2016 of Rwanda. No data until 1964. Number of actual observations by date: 52.
Source name:
World Development Indicators
Source organization:
International Monetary Fund, International Financial Statistics and data files, and World Bank and OECD GDP estimates.
Categories, topics:
Financial Sector
Last updated:
apr 23, 2017
Indicators value changes by year
Maximum:
28.453
jan 1, 1995
At the date of observation
Value
Absolute change
Change from previous value
jan 1, 1965
6.015
+6.015
0.0%
jan 1, 1966
9.785
+3.77
62.67%
jan 1, 1967
10.131
+0.346
3.54%
jan 1, 1968
8.124
-2.008
-19.82%
jan 1, 1969
9.241
+1.117
13.76%
jan 1, 1970
10.004
+0.763
8.25%
jan 1, 1971
8.988
-1.016
-10.15%
jan 1, 1972
11.09
+2.102
23.39%
jan 1, 1973
12.722
+1.632
14.71%
jan 1, 1974
14.569
+1.847
14.52%
jan 1, 1975
18.023
+3.455
23.71%
jan 1, 1976
8.962
-9.061
-50.28%
jan 1, 1977
7.005
-1.956
-21.83%
jan 1, 1978
6.53
-0.476
-6.79%
jan 1, 1979
6.335
-0.195
-2.99%
jan 1, 1980
3.238
-3.096
-48.88%
jan 1, 1981
3.223
-0.015
-0.47%
jan 1, 1982
4.142
+0.919
28.51%
jan 1, 1983
6.284
+2.141
51.69%
jan 1, 1984
8.45
+2.166
34.47%
jan 1, 1985
8.538
+0.089
1.05%
jan 1, 1986
9.534
+0.996
11.67%
jan 1, 1987
10.267
+0.733
7.69%
jan 1, 1988
12.544
+2.277
22.17%
jan 1, 1989
14.512
+1.968
15.69%
jan 1, 1990
16.357
+1.845
12.71%
jan 1, 1991
17.074
+0.717
4.38%
jan 1, 1992
12.993
-4.081
-23.9%
jan 1, 1993
15.215
+2.222
17.1%
jan 1, 1994
17.908
+2.693
17.7%
jan 1, 1995
28.453
+10.545
58.88%
jan 1, 1996
12.979
-15.474
-54.39%
jan 1, 1997
10.211
-2.768
-21.33%
jan 1, 1998
12.47
+2.259
22.13%
jan 1, 1999
12.707
+0.237
1.9%
jan 1, 2000
14.742
+2.035
16.01%
jan 1, 2001
13.055
-1.687
-11.44%
jan 1, 2002
11.955
-1.1
-8.43%
jan 1, 2003
10.796
-1.159
-9.69%
jan 1, 2004
12.097
+1.301
12.05%
jan 1, 2005
8.658
-3.439
-28.43%
jan 1, 2006
7.551
-1.107
-12.79%
jan 1, 2007
7.348
-0.203
-2.69%
jan 1, 2008
8.683
+1.336
18.18%
jan 1, 2009
8.981
+0.298
3.43%
jan 1, 2010
7.28
-1.701
-18.94%
jan 1, 2011
8.521
+1.241
17.05%
jan 1, 2012
9.383
+0.862
10.12%
jan 1, 2013
13.63
+4.247
45.27%
jan 1, 2014
12.636
-0.995
-7.3%
jan 1, 2015
17.539
+4.904
38.81%
jan 1, 2016
19.595
+2.056
11.72%
Ranking of countries by current statistics by years


Comments: