29
/
en
AIzaSyAYiBZKx7MnpbEhh9jyipgxe19OcubqV5w
April 1, 2024
238150
Seychelles
SYC
true
2
1
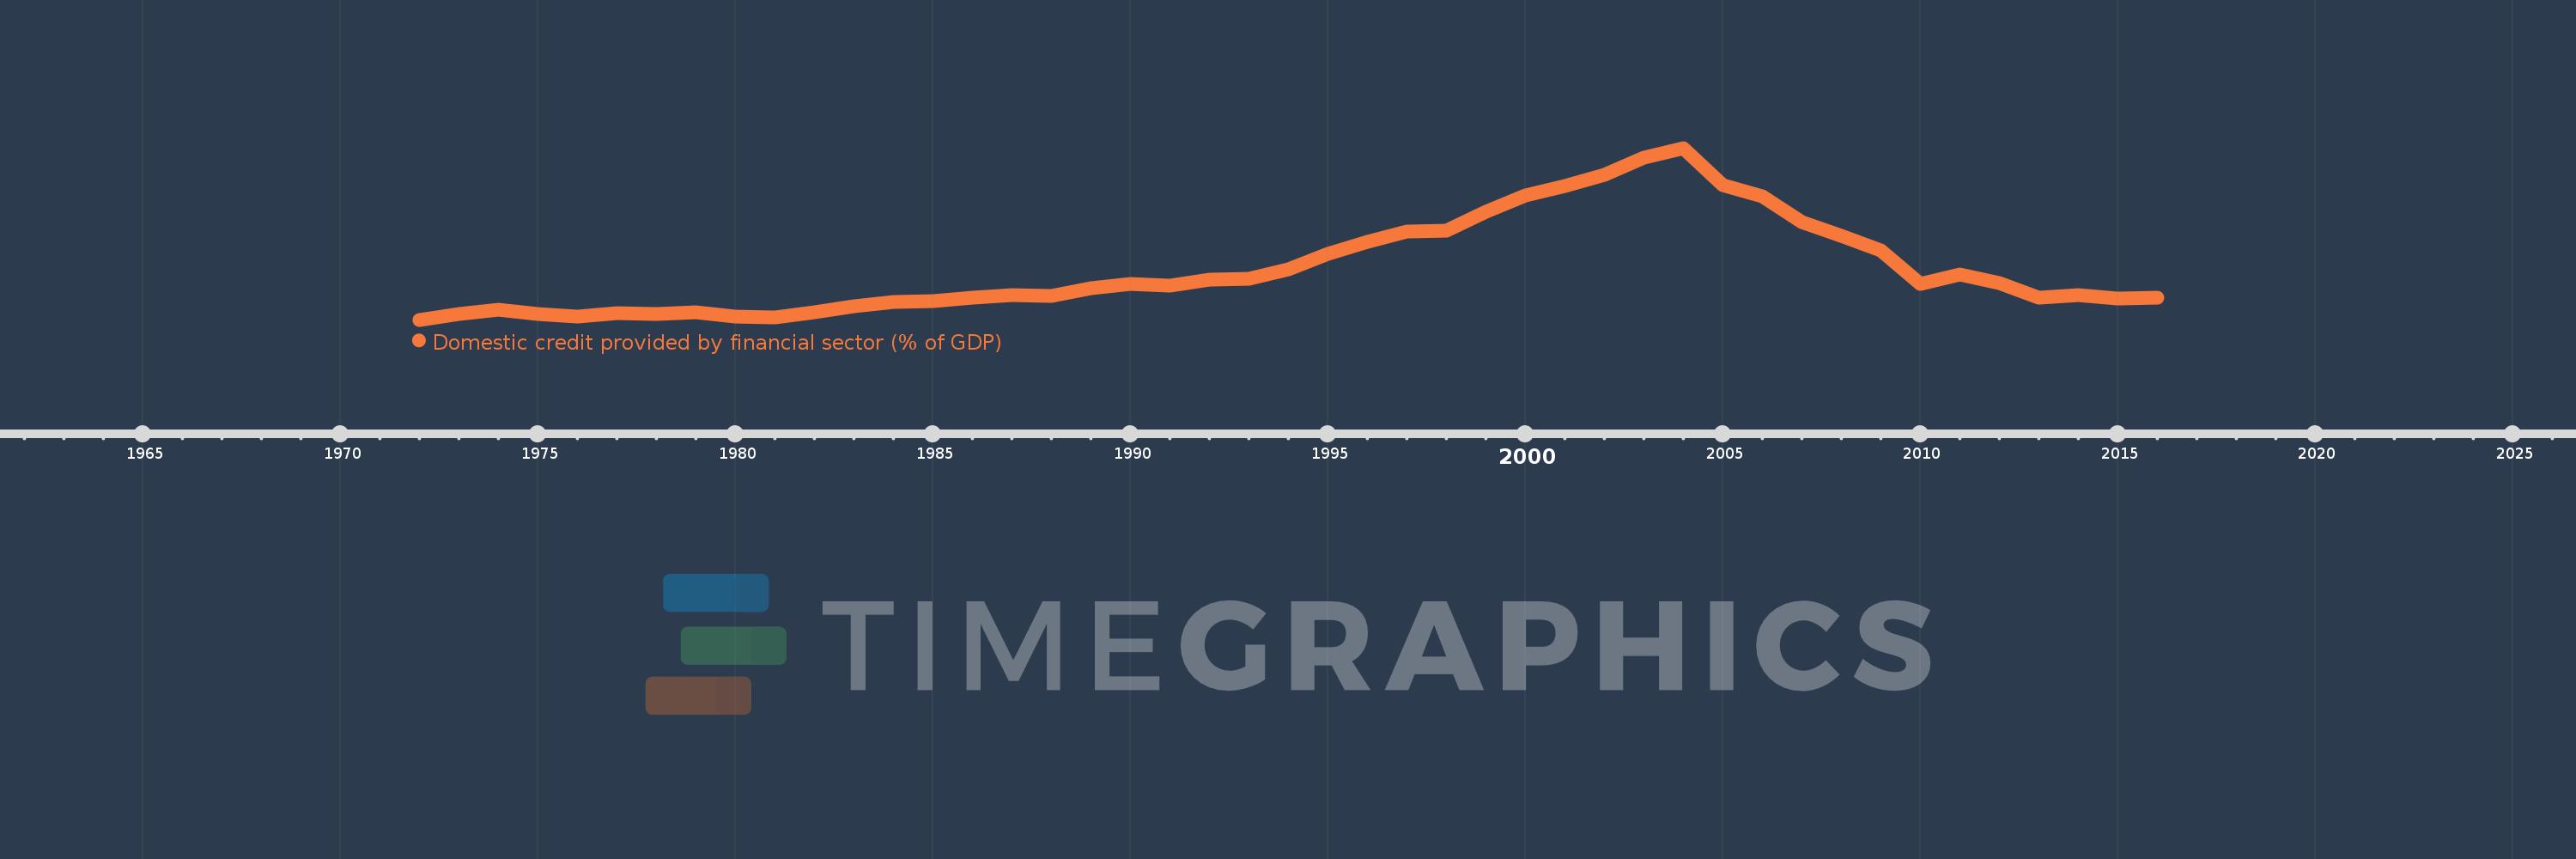
Domestic credit provided by financial sector (% of GDP)
2016,2015,2014,2013,2012,2011,2010,2009,2008,2007,2006,2005,2004,2003,2002,2001,2000,1999,1998,1997,1996,1995,1994,1993,1992,1991,1990,1989,1988,1987,1986,1985,1984,1983,1982,1981,1980,1979,1978,1977,1976,1975,1974,1973,1972
This statistics in other country:
AfghanistanAlbaniaAlgeriaAngolaAntigua and BarbudaArab WorldArgentinaArmeniaArubaAustraliaAustriaAzerbaijanBahamas, TheBahrainBangladeshBarbadosBelarusBelgiumBelizeBeninBhutanBoliviaBosnia and HerzegovinaBotswanaBrazilBrunei DarussalamBulgariaBurkina FasoBurundiCabo VerdeCambodiaCameroonCanadaCaribbean small statesCentral African RepublicCentral Europe and the BalticsChadChileChinaColombiaComorosCongo, Dem. Rep.Congo, Rep.Costa RicaCote d'IvoireCroatiaCyprusCzech RepublicDenmarkDjiboutiDominicaDominican RepublicEarly-demographic dividendEast Asia & PacificEast Asia & Pacific (excluding high income)East Asia & Pacific (IDA & IBRD countries)EcuadorEgypt, Arab Rep.El SalvadorEquatorial GuineaEritreaEstoniaEthiopiaEuro areaEurope & Central AsiaEurope & Central Asia (excluding high income)Europe & Central Asia (IDA & IBRD countries)European UnionFijiFinlandFragile and conflict affected situationsFranceGabonGambia, TheGeorgiaGermanyGhanaGreeceGrenadaGuatemalaGuineaGuinea-BissauGuyanaHaitiHeavily indebted poor countries (HIPC)High incomeHondurasHong Kong SAR, ChinaHungaryIBRD onlyIcelandIDA & IBRD totalIDA blendIDA onlyIDA totalIndiaIndonesiaIran, Islamic Rep.IraqIrelandIsraelItalyJamaicaJapanJordanKazakhstanKenyaKorea, Rep.KosovoKuwaitKyrgyz RepublicLao PDRLate-demographic dividendLatin America & Caribbean Latin America & Caribbean (excluding high income)Latin America & the Caribbean (IDA & IBRD countries)LatviaLeast developed countries: UN classificationLebanonLesothoLiberiaLibyaLithuaniaLow & middle incomeLow incomeLower middle incomeLuxembourgMacao SAR, ChinaMacedonia, FYRMadagascarMalawiMalaysiaMaldivesMaliMaltaMauritaniaMauritiusMexicoMicronesia, Fed. Sts.Middle East & North AfricaMiddle East & North Africa (excluding high income)Middle East & North Africa (IDA & IBRD countries)Middle incomeMoldovaMongoliaMontenegroMoroccoMozambiqueMyanmarNamibiaNepalNetherlandsNew ZealandNicaraguaNigerNigeriaNorth AmericaNorwayOECD membersOmanOther small statesPacific island small statesPakistanPanamaPapua New GuineaParaguayPeruPhilippinesPolandPortugalPost-demographic dividendPre-demographic dividendQatarRomaniaRussian FederationRwandaSamoaSao Tome and PrincipeSaudi ArabiaSenegalSerbiaSeychellesSierra LeoneSingaporeSlovak RepublicSloveniaSmall statesSolomon IslandsSouth AfricaSouth AsiaSouth Asia (IDA & IBRD)South SudanSpainSri LankaSt. Kitts and NevisSt. LuciaSt. Vincent and the GrenadinesSub-Saharan Africa Sub-Saharan Africa (excluding high income)Sub-Saharan Africa (IDA & IBRD countries)SudanSurinameSwazilandSwedenSwitzerlandSyrian Arab RepublicTajikistanTanzaniaThailandTimor-LesteTogoTongaTrinidad and TobagoTunisiaTurkeyUgandaUkraineUnited Arab EmiratesUnited KingdomUnited StatesUpper middle incomeUruguayVanuatuVenezuela, RBVietnamWest Bank and GazaWorldYemen, Rep.ZambiaZimbabwe Timeline:
This timeline shows a graph from 1972 to 2016 of Seychelles. No data until 1971. Number of actual observations by date: 45.
Source name:
World Development Indicators
Source organization:
International Monetary Fund, International Financial Statistics and data files, and World Bank and OECD GDP estimates.
Categories, topics:
Financial Sector
Last updated:
apr 23, 2017
Indicators value changes by year
Minimum:
18.921
jan 1, 1972
Maximum:
135.71
jan 1, 2004
At the date of observation
Value
Absolute change
Change from previous value
jan 1, 1972
18.921
+18.921
0.0%
jan 1, 1973
22.555
+3.634
19.21%
jan 1, 1974
25.896
+3.341
14.81%
jan 1, 1975
22.886
-3.01
-11.62%
jan 1, 1976
20.965
-1.921
-8.39%
jan 1, 1977
23.633
+2.668
12.72%
jan 1, 1978
22.77
-0.863
-3.65%
jan 1, 1979
23.722
+0.953
4.18%
jan 1, 1980
21.082
-2.64
-11.13%
jan 1, 1981
20.257
-0.825
-3.91%
jan 1, 1982
24.269
+4.012
19.81%
jan 1, 1983
28.199
+3.929
16.19%
jan 1, 1984
31.101
+2.902
10.29%
jan 1, 1985
31.879
+0.778
2.5%
jan 1, 1986
33.82
+1.941
6.09%
jan 1, 1987
35.775
+1.955
5.78%
jan 1, 1988
35.196
-0.579
-1.62%
jan 1, 1989
40.399
+5.203
14.78%
jan 1, 1990
43.539
+3.14
7.77%
jan 1, 1991
42.306
-1.233
-2.83%
jan 1, 1992
46.371
+4.065
9.61%
jan 1, 1993
46.592
+0.221
0.48%
jan 1, 1994
53.058
+6.466
13.88%
jan 1, 1995
63.662
+10.604
19.98%
jan 1, 1996
72.138
+8.476
13.31%
jan 1, 1997
78.904
+6.766
9.38%
jan 1, 1998
79.65
+0.745
0.94%
jan 1, 1999
92.329
+12.68
15.92%
jan 1, 2000
103.363
+11.034
11.95%
jan 1, 2001
110.057
+6.694
6.48%
jan 1, 2002
117.314
+7.257
6.59%
jan 1, 2003
129.164
+11.849
10.1%
jan 1, 2004
135.71
+6.546
5.07%
jan 1, 2005
110.492
-25.218
-18.58%
jan 1, 2006
102.693
-7.8
-7.06%
jan 1, 2007
85.532
-17.161
-16.71%
jan 1, 2008
76.257
-9.275
-10.84%
jan 1, 2009
66.004
-10.253
-13.45%
jan 1, 2010
43.055
-22.949
-34.77%
jan 1, 2011
49.613
+6.557
15.23%
jan 1, 2012
43.921
-5.692
-11.47%
jan 1, 2013
34.138
-9.783
-22.27%
jan 1, 2014
35.404
+1.266
3.71%
jan 1, 2015
33.19
-2.214
-6.25%
jan 1, 2016
34.082
+0.892
2.69%
Ranking of countries by current statistics by years


Comments: