29
/
en
AIzaSyAYiBZKx7MnpbEhh9jyipgxe19OcubqV5w
April 1, 2024
187637
Malaysia
MYS
true
2
1
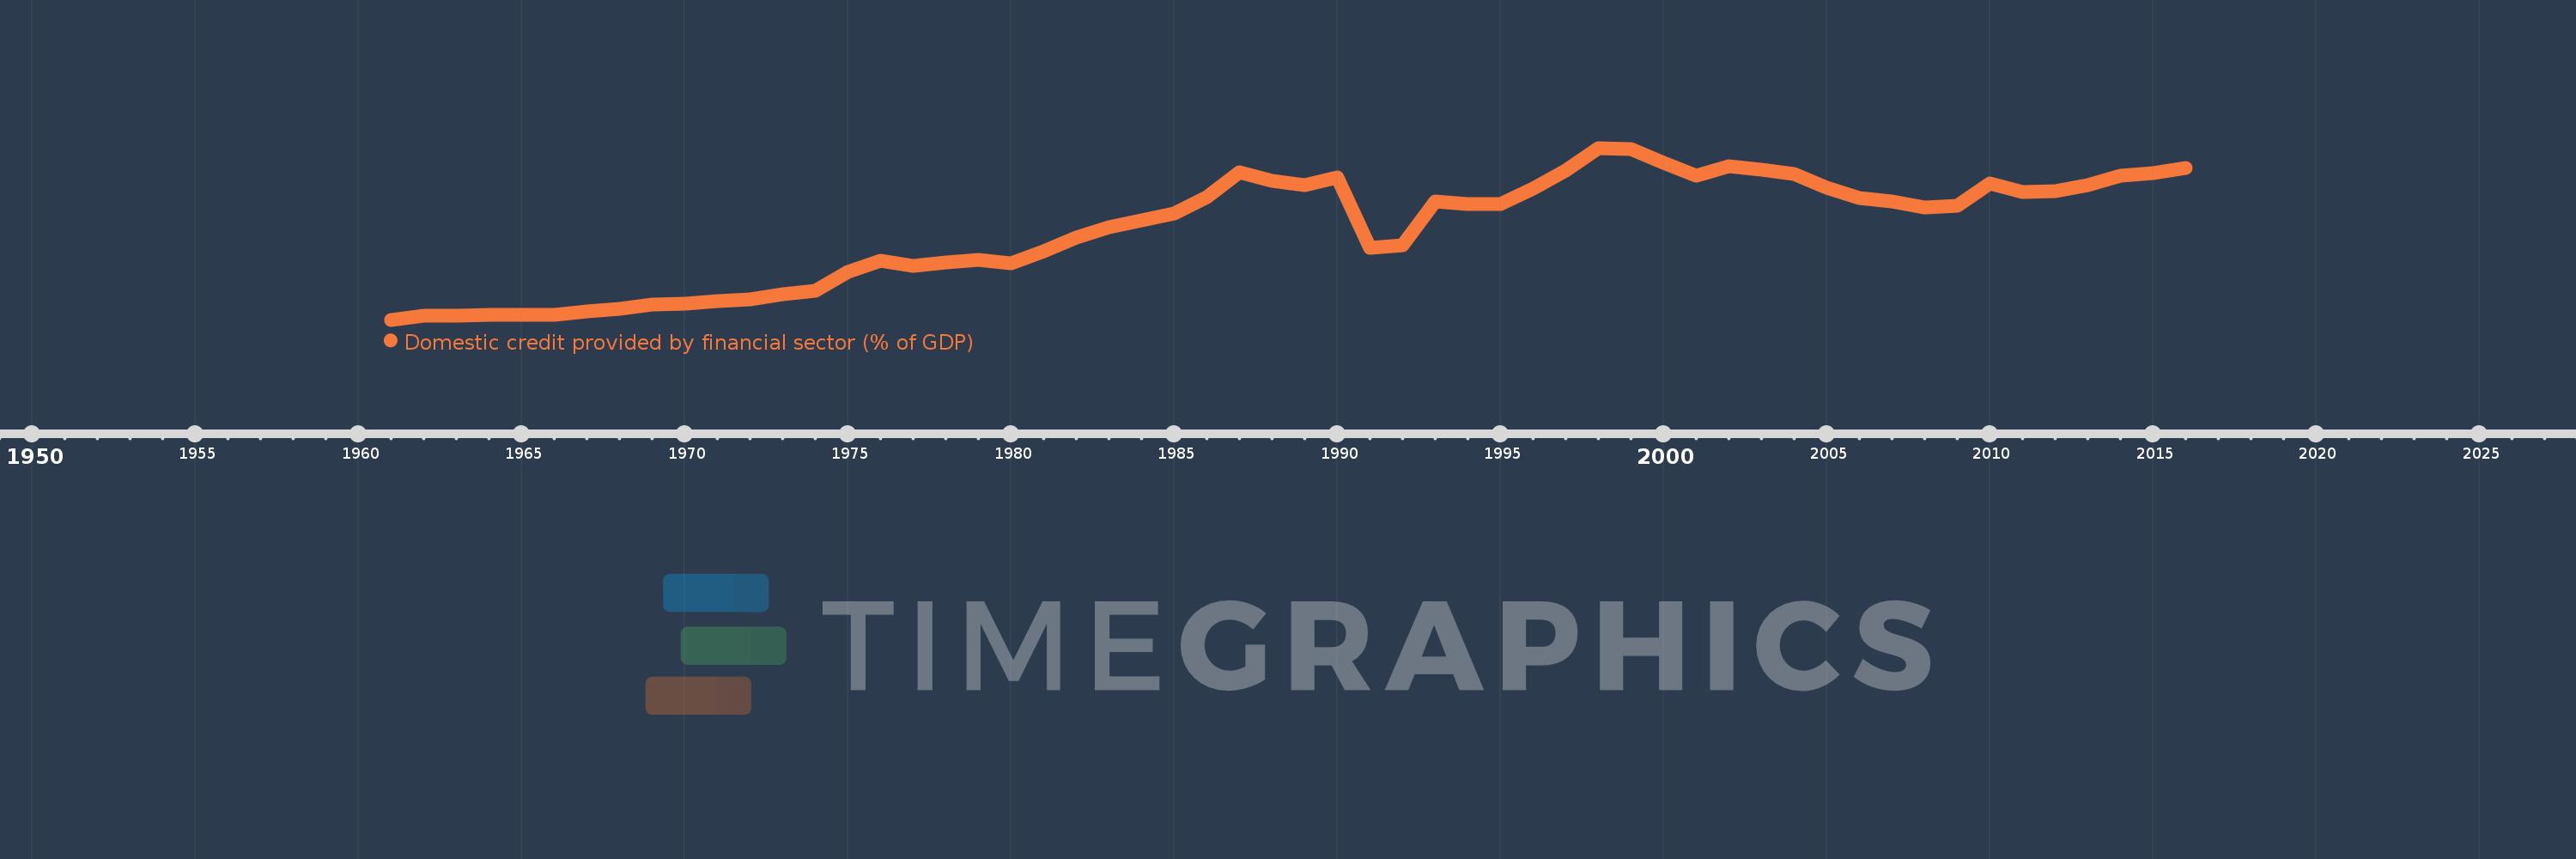
Domestic credit provided by financial sector (% of GDP)
2016,2015,2014,2013,2012,2011,2010,2009,2008,2007,2006,2005,2004,2003,2002,2001,2000,1999,1998,1997,1996,1995,1994,1993,1992,1991,1990,1989,1988,1987,1986,1985,1984,1983,1982,1981,1980,1979,1978,1977,1976,1975,1974,1973,1972,1971,1970,1969,1968,1967,1966,1965,1964,1963,1962,1961
This statistics in other country:
AfghanistanAlbaniaAlgeriaAngolaAntigua and BarbudaArab WorldArgentinaArmeniaArubaAustraliaAustriaAzerbaijanBahamas, TheBahrainBangladeshBarbadosBelarusBelgiumBelizeBeninBhutanBoliviaBosnia and HerzegovinaBotswanaBrazilBrunei DarussalamBulgariaBurkina FasoBurundiCabo VerdeCambodiaCameroonCanadaCaribbean small statesCentral African RepublicCentral Europe and the BalticsChadChileChinaColombiaComorosCongo, Dem. Rep.Congo, Rep.Costa RicaCote d'IvoireCroatiaCyprusCzech RepublicDenmarkDjiboutiDominicaDominican RepublicEarly-demographic dividendEast Asia & PacificEast Asia & Pacific (excluding high income)East Asia & Pacific (IDA & IBRD countries)EcuadorEgypt, Arab Rep.El SalvadorEquatorial GuineaEritreaEstoniaEthiopiaEuro areaEurope & Central AsiaEurope & Central Asia (excluding high income)Europe & Central Asia (IDA & IBRD countries)European UnionFijiFinlandFragile and conflict affected situationsFranceGabonGambia, TheGeorgiaGermanyGhanaGreeceGrenadaGuatemalaGuineaGuinea-BissauGuyanaHaitiHeavily indebted poor countries (HIPC)High incomeHondurasHong Kong SAR, ChinaHungaryIBRD onlyIcelandIDA & IBRD totalIDA blendIDA onlyIDA totalIndiaIndonesiaIran, Islamic Rep.IraqIrelandIsraelItalyJamaicaJapanJordanKazakhstanKenyaKorea, Rep.KosovoKuwaitKyrgyz RepublicLao PDRLate-demographic dividendLatin America & Caribbean Latin America & Caribbean (excluding high income)Latin America & the Caribbean (IDA & IBRD countries)LatviaLeast developed countries: UN classificationLebanonLesothoLiberiaLibyaLithuaniaLow & middle incomeLow incomeLower middle incomeLuxembourgMacao SAR, ChinaMacedonia, FYRMadagascarMalawiMalaysiaMaldivesMaliMaltaMauritaniaMauritiusMexicoMicronesia, Fed. Sts.Middle East & North AfricaMiddle East & North Africa (excluding high income)Middle East & North Africa (IDA & IBRD countries)Middle incomeMoldovaMongoliaMontenegroMoroccoMozambiqueMyanmarNamibiaNepalNetherlandsNew ZealandNicaraguaNigerNigeriaNorth AmericaNorwayOECD membersOmanOther small statesPacific island small statesPakistanPanamaPapua New GuineaParaguayPeruPhilippinesPolandPortugalPost-demographic dividendPre-demographic dividendQatarRomaniaRussian FederationRwandaSamoaSao Tome and PrincipeSaudi ArabiaSenegalSerbiaSeychellesSierra LeoneSingaporeSlovak RepublicSloveniaSmall statesSolomon IslandsSouth AfricaSouth AsiaSouth Asia (IDA & IBRD)South SudanSpainSri LankaSt. Kitts and NevisSt. LuciaSt. Vincent and the GrenadinesSub-Saharan Africa Sub-Saharan Africa (excluding high income)Sub-Saharan Africa (IDA & IBRD countries)SudanSurinameSwazilandSwedenSwitzerlandSyrian Arab RepublicTajikistanTanzaniaThailandTimor-LesteTogoTongaTrinidad and TobagoTunisiaTurkeyUgandaUkraineUnited Arab EmiratesUnited KingdomUnited StatesUpper middle incomeUruguayVanuatuVenezuela, RBVietnamWest Bank and GazaWorldYemen, Rep.ZambiaZimbabwe Timeline:
This timeline shows a graph from 1961 to 2016 of Malaysia. No data until 1960. Number of actual observations by date: 56.
Source name:
World Development Indicators
Source organization:
International Monetary Fund, International Financial Statistics and data files, and World Bank and OECD GDP estimates.
Categories, topics:
Financial Sector
Last updated:
apr 23, 2017
Indicators value changes by year
Maximum:
163.355
jan 1, 1998
At the date of observation
Value
Absolute change
Change from previous value
jan 1, 1961
7.117
+7.117
0.0%
jan 1, 1962
10.745
+3.628
50.98%
jan 1, 1963
10.963
+0.218
2.02%
jan 1, 1964
11.377
+0.414
3.78%
jan 1, 1965
11.609
+0.232
2.04%
jan 1, 1966
11.189
-0.42
-3.62%
jan 1, 1967
14.816
+3.627
32.41%
jan 1, 1968
16.998
+2.182
14.73%
jan 1, 1969
20.689
+3.691
21.72%
jan 1, 1970
21.398
+0.709
3.43%
jan 1, 1971
24.116
+2.718
12.7%
jan 1, 1972
26.004
+1.888
7.83%
jan 1, 1973
30.242
+4.238
16.3%
jan 1, 1974
33.544
+3.302
10.92%
jan 1, 1975
50.304
+16.76
49.96%
jan 1, 1976
60.99
+10.686
21.24%
jan 1, 1977
56.317
-4.674
-7.66%
jan 1, 1978
59.357
+3.04
5.4%
jan 1, 1979
61.488
+2.131
3.59%
jan 1, 1980
58.813
-2.675
-4.35%
jan 1, 1981
69.474
+10.661
18.13%
jan 1, 1982
81.71
+12.236
17.61%
jan 1, 1983
90.942
+9.232
11.3%
jan 1, 1984
97.272
+6.33
6.96%
jan 1, 1985
103.55
+6.278
6.45%
jan 1, 1986
118.602
+15.052
14.54%
jan 1, 1987
141.387
+22.785
19.21%
jan 1, 1988
133.69
-7.696
-5.44%
jan 1, 1989
129.512
-4.178
-3.13%
jan 1, 1990
136.211
+6.699
5.17%
jan 1, 1991
72.674
-63.537
-46.65%
jan 1, 1992
75.11
+2.436
3.35%
jan 1, 1993
114.612
+39.502
52.59%
jan 1, 1994
112.505
-2.107
-1.84%
jan 1, 1995
112.218
-0.287
-0.25%
jan 1, 1996
126.707
+14.489
12.91%
jan 1, 1997
142.424
+15.718
12.4%
jan 1, 1998
163.355
+20.93
14.7%
jan 1, 1999
162.127
-1.228
-0.75%
jan 1, 2000
150.105
-12.022
-7.42%
jan 1, 2001
138.372
-11.733
-7.82%
jan 1, 2002
146.531
+8.159
5.9%
jan 1, 2003
143.642
-2.89
-1.97%
jan 1, 2004
139.848
-3.794
-2.64%
jan 1, 2005
127.483
-12.365
-8.84%
jan 1, 2006
117.656
-9.828
-7.71%
jan 1, 2007
114.577
-3.079
-2.62%
jan 1, 2008
109.428
-5.149
-4.49%
jan 1, 2009
110.849
+1.421
1.3%
jan 1, 2010
131.054
+20.205
18.23%
jan 1, 2011
123.291
-7.762
-5.92%
jan 1, 2012
124.408
+1.117
0.91%
jan 1, 2013
129.848
+5.439
4.37%
jan 1, 2014
138.36
+8.513
6.56%
jan 1, 2015
140.508
+2.147
1.55%
jan 1, 2016
144.801
+4.293
3.06%
Ranking of countries by current statistics by years


Comments: