29
/
en
AIzaSyAYiBZKx7MnpbEhh9jyipgxe19OcubqV5w
April 1, 2024
277523
Uruguay
URY
true
2
1
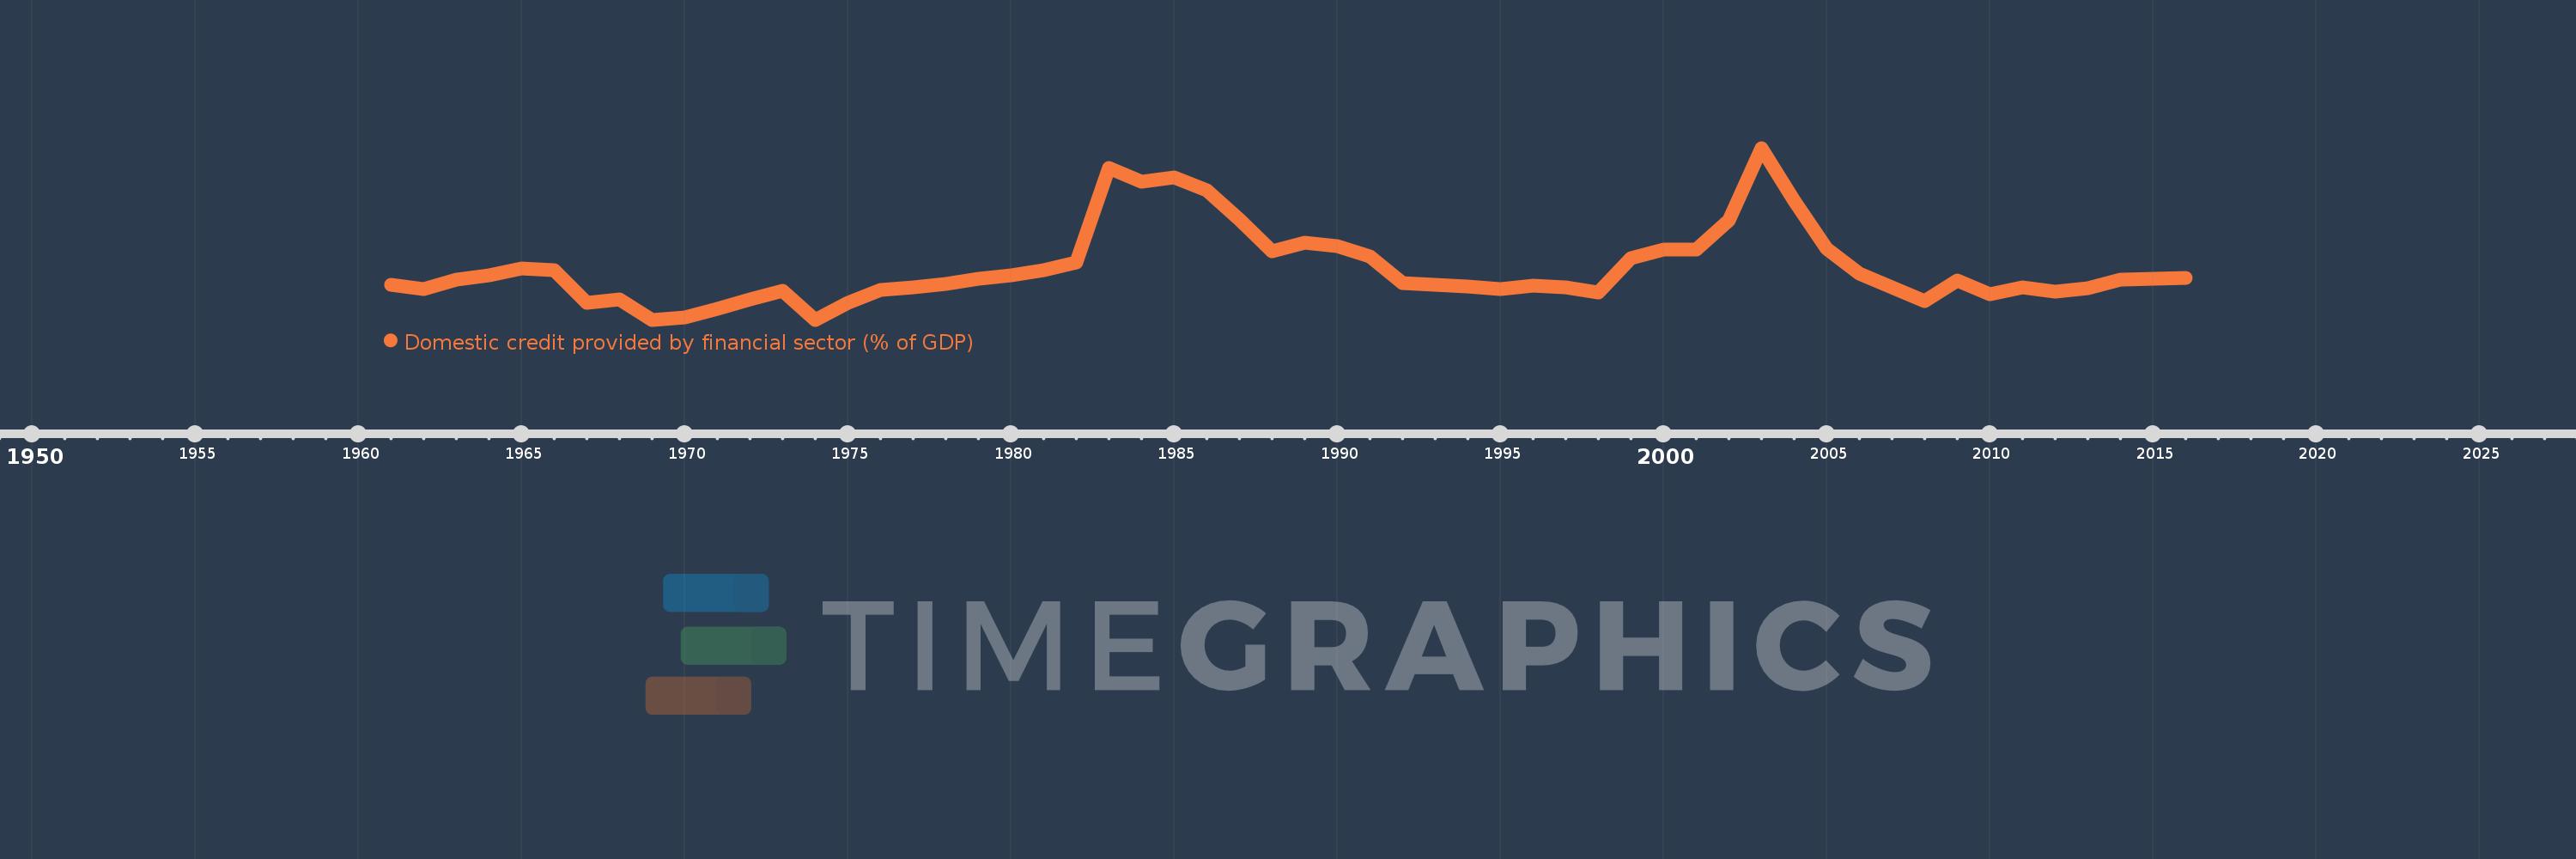
Domestic credit provided by financial sector (% of GDP)
2016,2015,2014,2013,2012,2011,2010,2009,2008,2007,2006,2005,2004,2003,2002,2001,2000,1999,1998,1997,1996,1995,1994,1993,1992,1991,1990,1989,1988,1987,1986,1985,1984,1983,1982,1981,1980,1979,1978,1977,1976,1975,1974,1973,1972,1971,1970,1969,1968,1967,1966,1965,1964,1963,1962,1961
This statistics in other country:
AfghanistanAlbaniaAlgeriaAngolaAntigua and BarbudaArab WorldArgentinaArmeniaArubaAustraliaAustriaAzerbaijanBahamas, TheBahrainBangladeshBarbadosBelarusBelgiumBelizeBeninBhutanBoliviaBosnia and HerzegovinaBotswanaBrazilBrunei DarussalamBulgariaBurkina FasoBurundiCabo VerdeCambodiaCameroonCanadaCaribbean small statesCentral African RepublicCentral Europe and the BalticsChadChileChinaColombiaComorosCongo, Dem. Rep.Congo, Rep.Costa RicaCote d'IvoireCroatiaCyprusCzech RepublicDenmarkDjiboutiDominicaDominican RepublicEarly-demographic dividendEast Asia & PacificEast Asia & Pacific (excluding high income)East Asia & Pacific (IDA & IBRD countries)EcuadorEgypt, Arab Rep.El SalvadorEquatorial GuineaEritreaEstoniaEthiopiaEuro areaEurope & Central AsiaEurope & Central Asia (excluding high income)Europe & Central Asia (IDA & IBRD countries)European UnionFijiFinlandFragile and conflict affected situationsFranceGabonGambia, TheGeorgiaGermanyGhanaGreeceGrenadaGuatemalaGuineaGuinea-BissauGuyanaHaitiHeavily indebted poor countries (HIPC)High incomeHondurasHong Kong SAR, ChinaHungaryIBRD onlyIcelandIDA & IBRD totalIDA blendIDA onlyIDA totalIndiaIndonesiaIran, Islamic Rep.IraqIrelandIsraelItalyJamaicaJapanJordanKazakhstanKenyaKorea, Rep.KosovoKuwaitKyrgyz RepublicLao PDRLate-demographic dividendLatin America & Caribbean Latin America & Caribbean (excluding high income)Latin America & the Caribbean (IDA & IBRD countries)LatviaLeast developed countries: UN classificationLebanonLesothoLiberiaLibyaLithuaniaLow & middle incomeLow incomeLower middle incomeLuxembourgMacao SAR, ChinaMacedonia, FYRMadagascarMalawiMalaysiaMaldivesMaliMaltaMauritaniaMauritiusMexicoMicronesia, Fed. Sts.Middle East & North AfricaMiddle East & North Africa (excluding high income)Middle East & North Africa (IDA & IBRD countries)Middle incomeMoldovaMongoliaMontenegroMoroccoMozambiqueMyanmarNamibiaNepalNetherlandsNew ZealandNicaraguaNigerNigeriaNorth AmericaNorwayOECD membersOmanOther small statesPacific island small statesPakistanPanamaPapua New GuineaParaguayPeruPhilippinesPolandPortugalPost-demographic dividendPre-demographic dividendQatarRomaniaRussian FederationRwandaSamoaSao Tome and PrincipeSaudi ArabiaSenegalSerbiaSeychellesSierra LeoneSingaporeSlovak RepublicSloveniaSmall statesSolomon IslandsSouth AfricaSouth AsiaSouth Asia (IDA & IBRD)South SudanSpainSri LankaSt. Kitts and NevisSt. LuciaSt. Vincent and the GrenadinesSub-Saharan Africa Sub-Saharan Africa (excluding high income)Sub-Saharan Africa (IDA & IBRD countries)SudanSurinameSwazilandSwedenSwitzerlandSyrian Arab RepublicTajikistanTanzaniaThailandTimor-LesteTogoTongaTrinidad and TobagoTunisiaTurkeyUgandaUkraineUnited Arab EmiratesUnited KingdomUnited StatesUpper middle incomeUruguayVanuatuVenezuela, RBVietnamWest Bank and GazaWorldYemen, Rep.ZambiaZimbabwe Timeline:
This timeline shows a graph from 1961 to 2016 of Uruguay. No data until 1960. Number of actual observations by date: 56.
Source name:
World Development Indicators
Source organization:
International Monetary Fund, International Financial Statistics and data files, and World Bank and OECD GDP estimates.
Categories, topics:
Financial Sector
Last updated:
apr 23, 2017
Indicators value changes by year
Minimum:
15.756
jan 1, 1974
Maximum:
99.918
jan 1, 2003
At the date of observation
Value
Absolute change
Change from previous value
jan 1, 1961
32.752
+32.752
0.0%
jan 1, 1962
30.903
-1.848
-5.64%
jan 1, 1963
35.356
+4.452
14.41%
jan 1, 1964
37.528
+2.172
6.14%
jan 1, 1965
41.057
+3.529
9.4%
jan 1, 1966
39.947
-1.11
-2.7%
jan 1, 1967
23.896
-16.051
-40.18%
jan 1, 1968
25.707
+1.811
7.58%
jan 1, 1969
15.794
-9.913
-38.56%
jan 1, 1970
16.827
+1.033
6.54%
jan 1, 1971
20.986
+4.159
24.72%
jan 1, 1972
25.621
+4.634
22.08%
jan 1, 1973
29.741
+4.12
16.08%
jan 1, 1974
15.756
-13.985
-47.02%
jan 1, 1975
23.888
+8.132
51.61%
jan 1, 1976
30.375
+6.487
27.16%
jan 1, 1977
31.666
+1.291
4.25%
jan 1, 1978
33.338
+1.672
5.28%
jan 1, 1979
35.904
+2.566
7.7%
jan 1, 1980
37.583
+1.679
4.68%
jan 1, 1981
39.851
+2.268
6.03%
jan 1, 1982
43.841
+3.991
10.01%
jan 1, 1983
89.936
+46.095
105.14%
jan 1, 1984
83.183
-6.754
-7.51%
jan 1, 1985
85.428
+2.245
2.7%
jan 1, 1986
79.284
-6.143
-7.19%
jan 1, 1987
64.761
-14.524
-18.32%
jan 1, 1988
49.288
-15.472
-23.89%
jan 1, 1989
53.432
+4.144
8.41%
jan 1, 1990
51.79
-1.642
-3.07%
jan 1, 1991
46.667
-5.123
-9.89%
jan 1, 1992
33.765
-12.901
-27.65%
jan 1, 1993
33.031
-0.735
-2.18%
jan 1, 1994
31.885
-1.146
-3.47%
jan 1, 1995
30.594
-1.29
-4.05%
jan 1, 1996
32.371
+1.777
5.81%
jan 1, 1997
31.552
-0.819
-2.53%
jan 1, 1998
29.184
-2.368
-7.51%
jan 1, 1999
45.777
+16.593
56.86%
jan 1, 2000
50.3
+4.523
9.88%
jan 1, 2001
50.229
-0.071
-0.14%
jan 1, 2002
64.379
+14.15
28.17%
jan 1, 2003
99.918
+35.539
55.2%
jan 1, 2004
73.965
-25.953
-25.97%
jan 1, 2005
50.761
-23.205
-31.37%
jan 1, 2006
38.377
-12.384
-24.4%
jan 1, 2007
31.714
-6.663
-17.36%
jan 1, 2008
25.029
-6.685
-21.08%
jan 1, 2009
34.818
+9.789
39.11%
jan 1, 2010
28.072
-6.746
-19.37%
jan 1, 2011
31.689
+3.616
12.88%
jan 1, 2012
29.36
-2.329
-7.35%
jan 1, 2013
31.403
+2.043
6.96%
jan 1, 2014
35.36
+3.957
12.6%
jan 1, 2015
35.637
+0.277
0.78%
jan 1, 2016
36.29
+0.653
1.83%
Ranking of countries by current statistics by years


Comments: