29
/
en
AIzaSyAYiBZKx7MnpbEhh9jyipgxe19OcubqV5w
April 1, 2024
97221
Cabo Verde
CPV
true
2
1
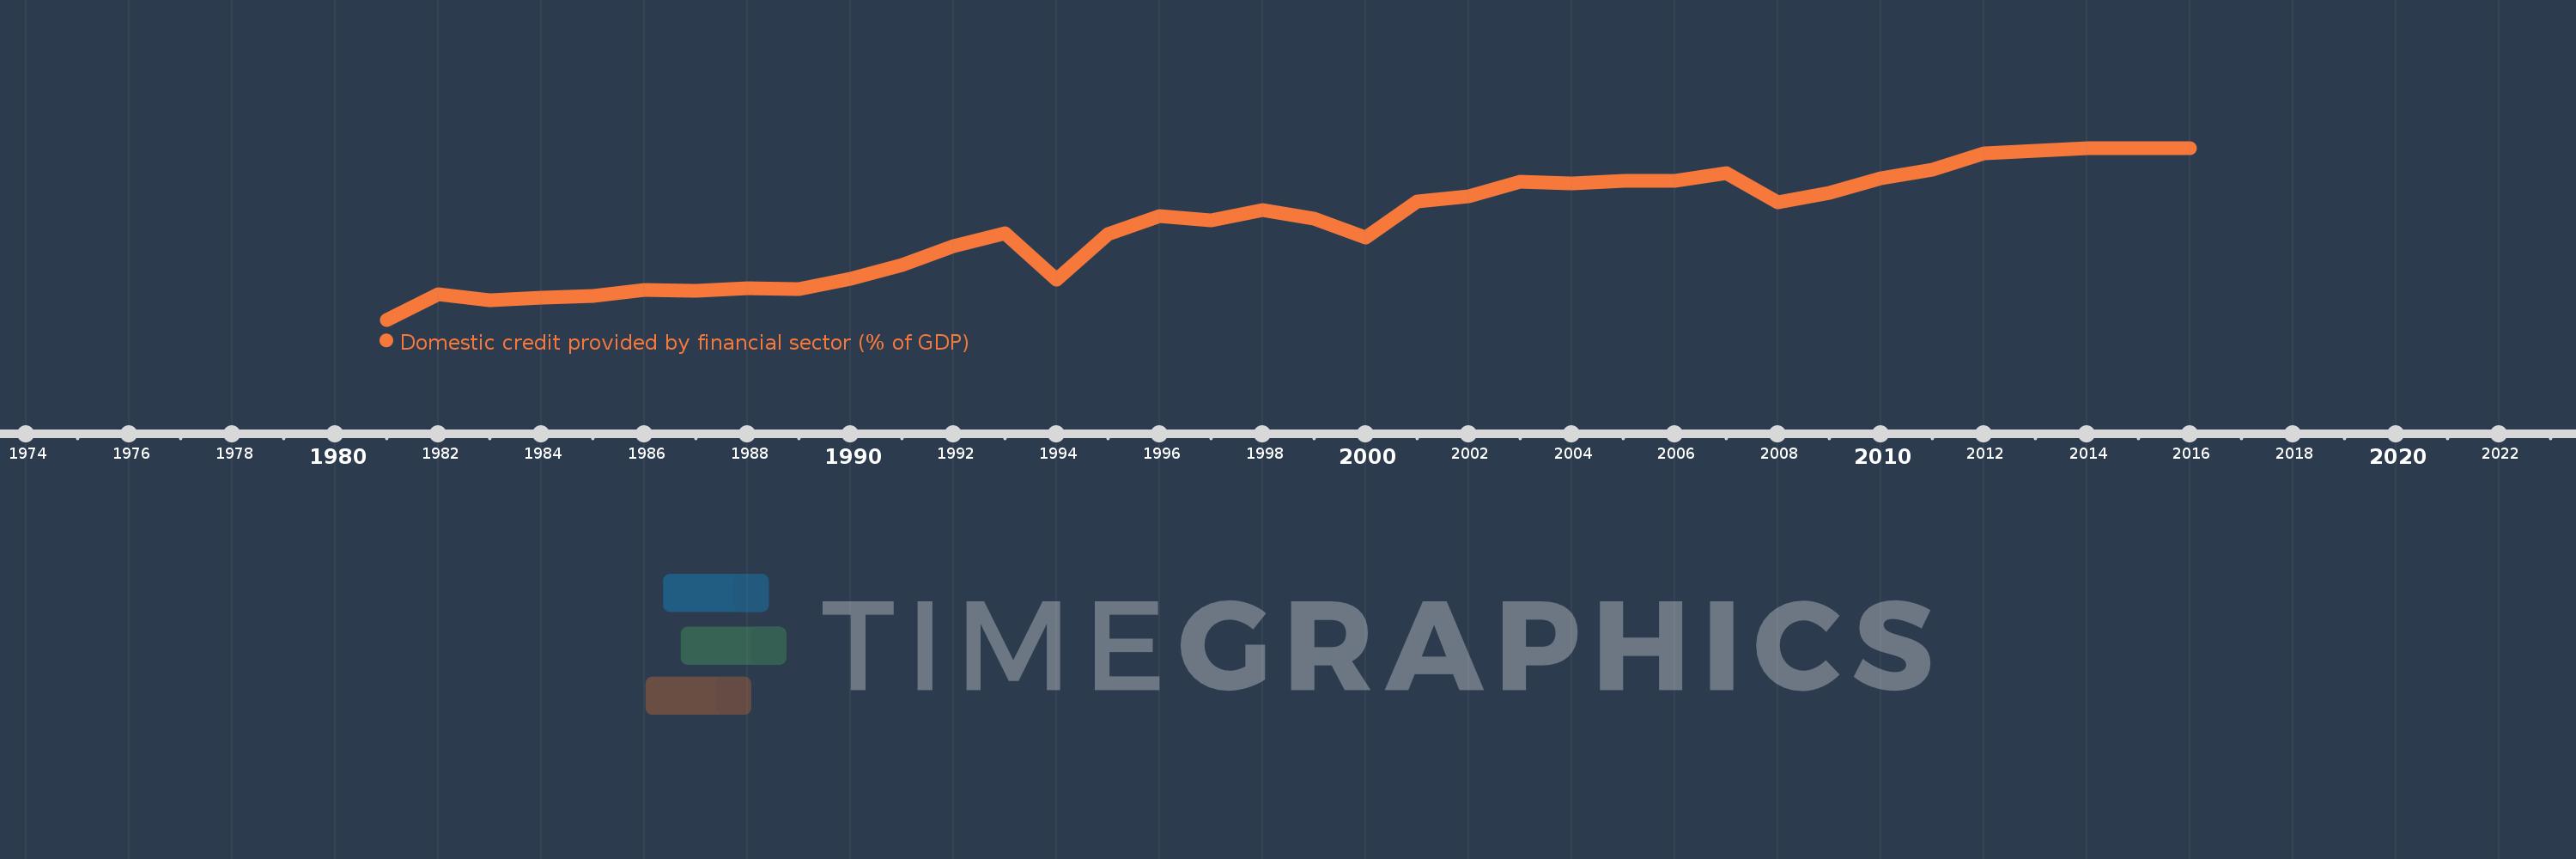
Domestic credit provided by financial sector (% of GDP)
2016,2015,2014,2013,2012,2011,2010,2009,2008,2007,2006,2005,2004,2003,2002,2001,2000,1999,1998,1997,1996,1995,1994,1993,1992,1991,1990,1989,1988,1987,1986,1985,1984,1983,1982,1981
This statistics in other country:
AfghanistanAlbaniaAlgeriaAngolaAntigua and BarbudaArab WorldArgentinaArmeniaArubaAustraliaAustriaAzerbaijanBahamas, TheBahrainBangladeshBarbadosBelarusBelgiumBelizeBeninBhutanBoliviaBosnia and HerzegovinaBotswanaBrazilBrunei DarussalamBulgariaBurkina FasoBurundiCabo VerdeCambodiaCameroonCanadaCaribbean small statesCentral African RepublicCentral Europe and the BalticsChadChileChinaColombiaComorosCongo, Dem. Rep.Congo, Rep.Costa RicaCote d'IvoireCroatiaCyprusCzech RepublicDenmarkDjiboutiDominicaDominican RepublicEarly-demographic dividendEast Asia & PacificEast Asia & Pacific (excluding high income)East Asia & Pacific (IDA & IBRD countries)EcuadorEgypt, Arab Rep.El SalvadorEquatorial GuineaEritreaEstoniaEthiopiaEuro areaEurope & Central AsiaEurope & Central Asia (excluding high income)Europe & Central Asia (IDA & IBRD countries)European UnionFijiFinlandFragile and conflict affected situationsFranceGabonGambia, TheGeorgiaGermanyGhanaGreeceGrenadaGuatemalaGuineaGuinea-BissauGuyanaHaitiHeavily indebted poor countries (HIPC)High incomeHondurasHong Kong SAR, ChinaHungaryIBRD onlyIcelandIDA & IBRD totalIDA blendIDA onlyIDA totalIndiaIndonesiaIran, Islamic Rep.IraqIrelandIsraelItalyJamaicaJapanJordanKazakhstanKenyaKorea, Rep.KosovoKuwaitKyrgyz RepublicLao PDRLate-demographic dividendLatin America & Caribbean Latin America & Caribbean (excluding high income)Latin America & the Caribbean (IDA & IBRD countries)LatviaLeast developed countries: UN classificationLebanonLesothoLiberiaLibyaLithuaniaLow & middle incomeLow incomeLower middle incomeLuxembourgMacao SAR, ChinaMacedonia, FYRMadagascarMalawiMalaysiaMaldivesMaliMaltaMauritaniaMauritiusMexicoMicronesia, Fed. Sts.Middle East & North AfricaMiddle East & North Africa (excluding high income)Middle East & North Africa (IDA & IBRD countries)Middle incomeMoldovaMongoliaMontenegroMoroccoMozambiqueMyanmarNamibiaNepalNetherlandsNew ZealandNicaraguaNigerNigeriaNorth AmericaNorwayOECD membersOmanOther small statesPacific island small statesPakistanPanamaPapua New GuineaParaguayPeruPhilippinesPolandPortugalPost-demographic dividendPre-demographic dividendQatarRomaniaRussian FederationRwandaSamoaSao Tome and PrincipeSaudi ArabiaSenegalSerbiaSeychellesSierra LeoneSingaporeSlovak RepublicSloveniaSmall statesSolomon IslandsSouth AfricaSouth AsiaSouth Asia (IDA & IBRD)South SudanSpainSri LankaSt. Kitts and NevisSt. LuciaSt. Vincent and the GrenadinesSub-Saharan Africa Sub-Saharan Africa (excluding high income)Sub-Saharan Africa (IDA & IBRD countries)SudanSurinameSwazilandSwedenSwitzerlandSyrian Arab RepublicTajikistanTanzaniaThailandTimor-LesteTogoTongaTrinidad and TobagoTunisiaTurkeyUgandaUkraineUnited Arab EmiratesUnited KingdomUnited StatesUpper middle incomeUruguayVanuatuVenezuela, RBVietnamWest Bank and GazaWorldYemen, Rep.ZambiaZimbabwe Timeline:
This timeline shows a graph from 1981 to 2016 of Cabo Verde. No data until 1980. Number of actual observations by date: 36.
Source name:
World Development Indicators
Source organization:
International Monetary Fund, International Financial Statistics and data files, and World Bank and OECD GDP estimates.
Categories, topics:
Financial Sector
Last updated:
apr 23, 2017
Indicators value changes by year
Minimum:
21.766
jan 1, 1981
Maximum:
84.152
jan 1, 2016
At the date of observation
Value
Absolute change
Change from previous value
jan 1, 1981
21.766
+21.766
0.0%
jan 1, 1982
30.889
+9.123
41.91%
jan 1, 1983
28.825
-2.065
-6.68%
jan 1, 1984
29.925
+1.1
3.82%
jan 1, 1985
30.271
+0.346
1.16%
jan 1, 1986
32.682
+2.411
7.96%
jan 1, 1987
32.244
-0.438
-1.34%
jan 1, 1988
33.262
+1.018
3.16%
jan 1, 1989
32.912
-0.35
-1.05%
jan 1, 1990
36.513
+3.601
10.94%
jan 1, 1991
41.582
+5.069
13.88%
jan 1, 1992
48.554
+6.972
16.77%
jan 1, 1993
53.248
+4.695
9.67%
jan 1, 1994
36.43
-16.818
-31.58%
jan 1, 1995
53.014
+16.584
45.52%
jan 1, 1996
59.412
+6.399
12.07%
jan 1, 1997
57.727
-1.686
-2.84%
jan 1, 1998
61.552
+3.825
6.63%
jan 1, 1999
58.504
-3.047
-4.95%
jan 1, 2000
51.618
-6.886
-11.77%
jan 1, 2001
64.685
+13.067
25.32%
jan 1, 2002
66.545
+1.86
2.88%
jan 1, 2003
71.822
+5.277
7.93%
jan 1, 2004
71.308
-0.514
-0.72%
jan 1, 2005
72.215
+0.907
1.27%
jan 1, 2006
72.337
+0.122
0.17%
jan 1, 2007
74.943
+2.606
3.6%
jan 1, 2008
64.403
-10.54
-14.06%
jan 1, 2009
67.841
+3.438
5.34%
jan 1, 2010
73.0
+5.159
7.6%
jan 1, 2011
76.128
+3.127
4.28%
jan 1, 2012
82.146
+6.018
7.91%
jan 1, 2013
83.151
+1.005
1.22%
jan 1, 2014
84.053
+0.902
1.08%
jan 1, 2015
84.141
+0.088
0.1%
jan 1, 2016
84.152
+0.011
0.01%
Ranking of countries by current statistics by years


Comments: