29
/
en
AIzaSyAYiBZKx7MnpbEhh9jyipgxe19OcubqV5w
April 1, 2024
211578
Niger
NER
true
2
1
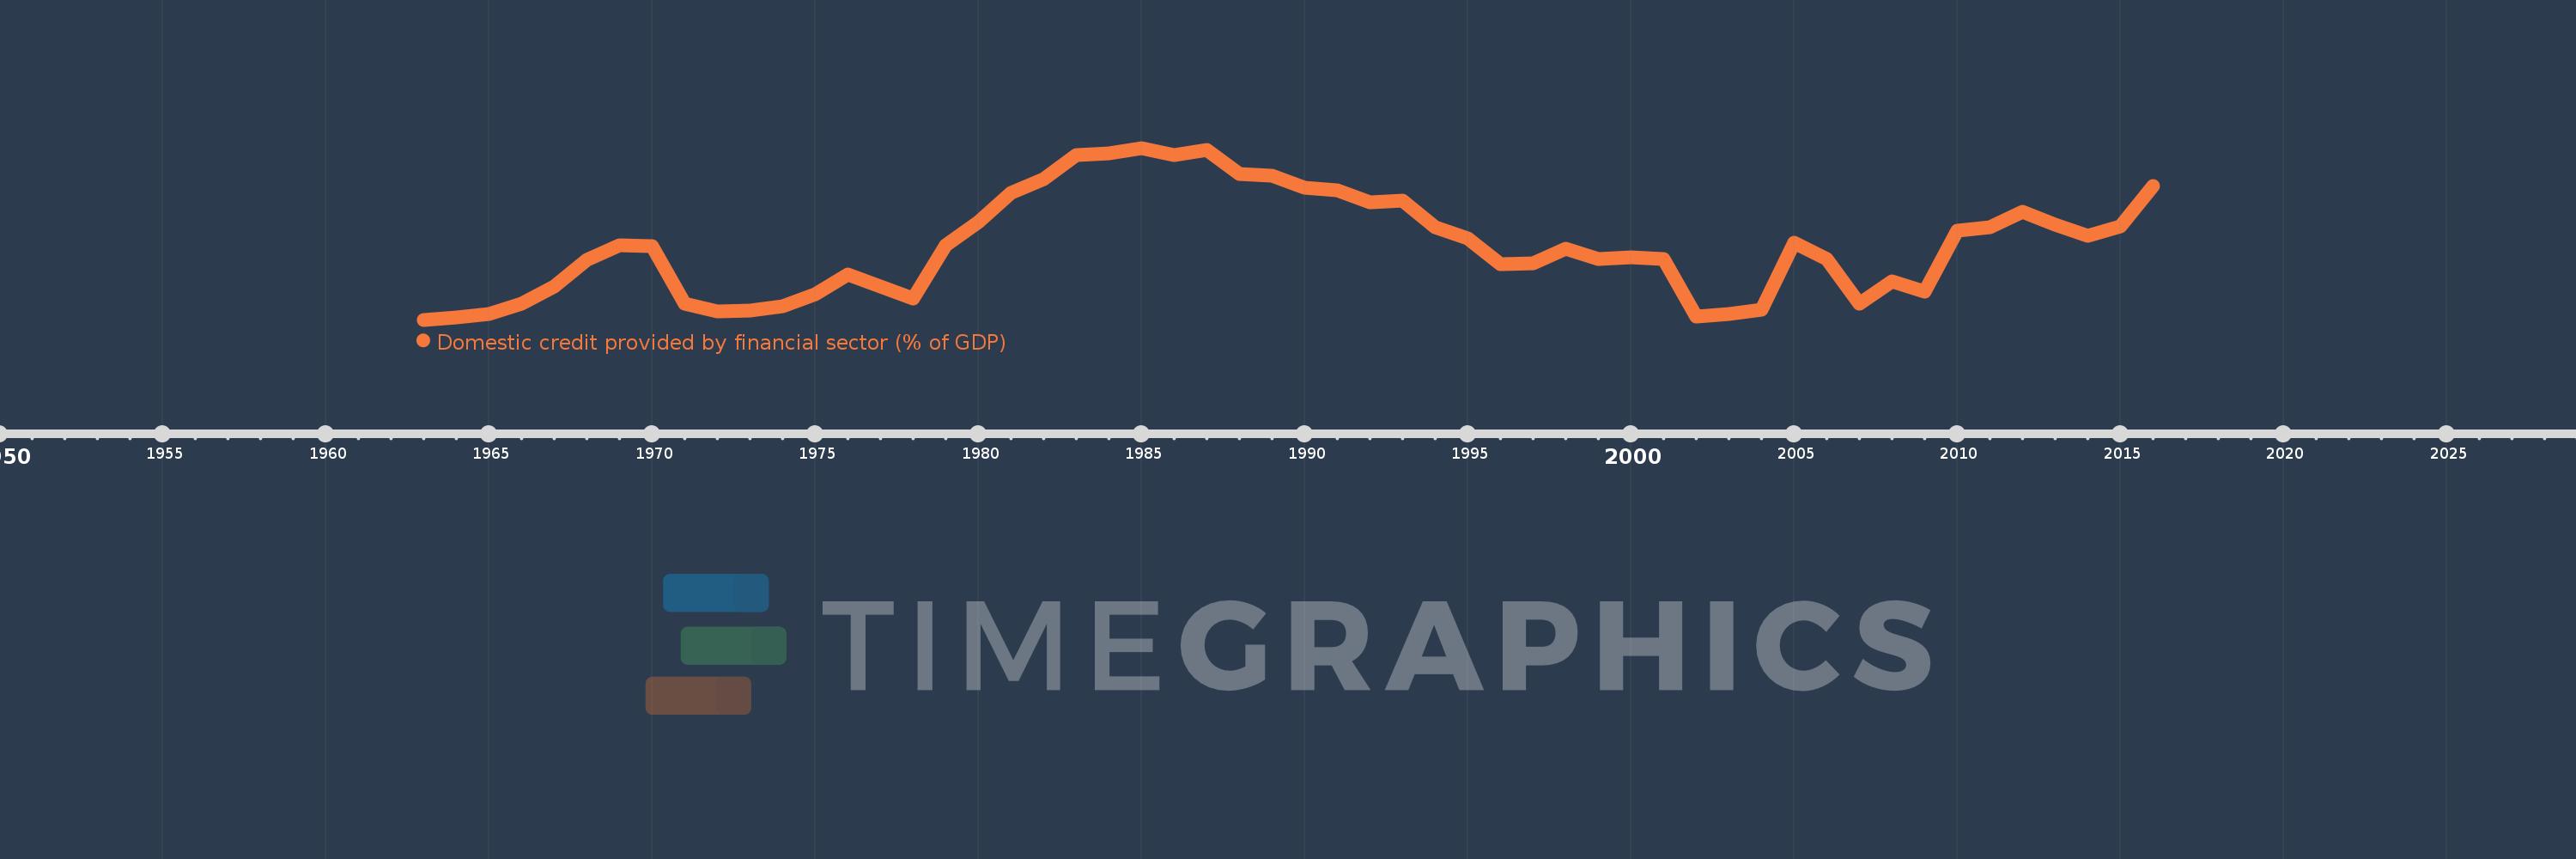
Domestic credit provided by financial sector (% of GDP)
2016,2015,2014,2013,2012,2011,2010,2009,2008,2007,2006,2005,2004,2003,2002,2001,2000,1999,1998,1997,1996,1995,1994,1993,1992,1991,1990,1989,1988,1987,1986,1985,1984,1983,1982,1981,1980,1979,1978,1977,1976,1975,1974,1973,1972,1971,1970,1969,1968,1967,1966,1965,1964,1963
This statistics in other country:
AfghanistanAlbaniaAlgeriaAngolaAntigua and BarbudaArab WorldArgentinaArmeniaArubaAustraliaAustriaAzerbaijanBahamas, TheBahrainBangladeshBarbadosBelarusBelgiumBelizeBeninBhutanBoliviaBosnia and HerzegovinaBotswanaBrazilBrunei DarussalamBulgariaBurkina FasoBurundiCabo VerdeCambodiaCameroonCanadaCaribbean small statesCentral African RepublicCentral Europe and the BalticsChadChileChinaColombiaComorosCongo, Dem. Rep.Congo, Rep.Costa RicaCote d'IvoireCroatiaCyprusCzech RepublicDenmarkDjiboutiDominicaDominican RepublicEarly-demographic dividendEast Asia & PacificEast Asia & Pacific (excluding high income)East Asia & Pacific (IDA & IBRD countries)EcuadorEgypt, Arab Rep.El SalvadorEquatorial GuineaEritreaEstoniaEthiopiaEuro areaEurope & Central AsiaEurope & Central Asia (excluding high income)Europe & Central Asia (IDA & IBRD countries)European UnionFijiFinlandFragile and conflict affected situationsFranceGabonGambia, TheGeorgiaGermanyGhanaGreeceGrenadaGuatemalaGuineaGuinea-BissauGuyanaHaitiHeavily indebted poor countries (HIPC)High incomeHondurasHong Kong SAR, ChinaHungaryIBRD onlyIcelandIDA & IBRD totalIDA blendIDA onlyIDA totalIndiaIndonesiaIran, Islamic Rep.IraqIrelandIsraelItalyJamaicaJapanJordanKazakhstanKenyaKorea, Rep.KosovoKuwaitKyrgyz RepublicLao PDRLate-demographic dividendLatin America & Caribbean Latin America & Caribbean (excluding high income)Latin America & the Caribbean (IDA & IBRD countries)LatviaLeast developed countries: UN classificationLebanonLesothoLiberiaLibyaLithuaniaLow & middle incomeLow incomeLower middle incomeLuxembourgMacao SAR, ChinaMacedonia, FYRMadagascarMalawiMalaysiaMaldivesMaliMaltaMauritaniaMauritiusMexicoMicronesia, Fed. Sts.Middle East & North AfricaMiddle East & North Africa (excluding high income)Middle East & North Africa (IDA & IBRD countries)Middle incomeMoldovaMongoliaMontenegroMoroccoMozambiqueMyanmarNamibiaNepalNetherlandsNew ZealandNicaraguaNigerNigeriaNorth AmericaNorwayOECD membersOmanOther small statesPacific island small statesPakistanPanamaPapua New GuineaParaguayPeruPhilippinesPolandPortugalPost-demographic dividendPre-demographic dividendQatarRomaniaRussian FederationRwandaSamoaSao Tome and PrincipeSaudi ArabiaSenegalSerbiaSeychellesSierra LeoneSingaporeSlovak RepublicSloveniaSmall statesSolomon IslandsSouth AfricaSouth AsiaSouth Asia (IDA & IBRD)South SudanSpainSri LankaSt. Kitts and NevisSt. LuciaSt. Vincent and the GrenadinesSub-Saharan Africa Sub-Saharan Africa (excluding high income)Sub-Saharan Africa (IDA & IBRD countries)SudanSurinameSwazilandSwedenSwitzerlandSyrian Arab RepublicTajikistanTanzaniaThailandTimor-LesteTogoTongaTrinidad and TobagoTunisiaTurkeyUgandaUkraineUnited Arab EmiratesUnited KingdomUnited StatesUpper middle incomeUruguayVanuatuVenezuela, RBVietnamWest Bank and GazaWorldYemen, Rep.ZambiaZimbabwe Timeline:
This timeline shows a graph from 1963 to 2016 of Niger. No data until 1962. Number of actual observations by date: 54.
Source name:
World Development Indicators
Source organization:
International Monetary Fund, International Financial Statistics and data files, and World Bank and OECD GDP estimates.
Categories, topics:
Financial Sector
Last updated:
apr 23, 2017
Indicators value changes by year
Maximum:
20.486
jan 1, 1985
At the date of observation
Value
Absolute change
Change from previous value
jan 1, 1963
3.009
+3.009
0.0%
jan 1, 1964
3.279
+0.27
8.97%
jan 1, 1965
3.557
+0.279
8.49%
jan 1, 1966
4.612
+1.054
29.64%
jan 1, 1967
6.399
+1.787
38.75%
jan 1, 1968
9.076
+2.677
41.84%
jan 1, 1969
10.558
+1.482
16.33%
jan 1, 1970
10.467
-0.091
-0.87%
jan 1, 1971
4.678
-5.788
-55.3%
jan 1, 1972
3.882
-0.796
-17.02%
jan 1, 1973
3.914
+0.032
0.82%
jan 1, 1974
4.349
+0.435
11.12%
jan 1, 1975
5.596
+1.247
28.67%
jan 1, 1976
7.59
+1.994
35.64%
jan 1, 1977
6.383
-1.208
-15.91%
jan 1, 1978
5.125
-1.257
-19.7%
jan 1, 1979
10.58
+5.455
106.43%
jan 1, 1980
12.907
+2.327
22.0%
jan 1, 1981
15.88
+2.973
23.03%
jan 1, 1982
17.34
+1.46
9.2%
jan 1, 1983
19.767
+2.426
13.99%
jan 1, 1984
19.929
+0.163
0.82%
jan 1, 1985
20.486
+0.557
2.79%
jan 1, 1986
19.757
-0.729
-3.56%
jan 1, 1987
20.291
+0.535
2.71%
jan 1, 1988
17.823
-2.469
-12.17%
jan 1, 1989
17.659
-0.163
-0.92%
jan 1, 1990
16.448
-1.211
-6.86%
jan 1, 1991
16.174
-0.275
-1.67%
jan 1, 1992
14.927
-1.247
-7.71%
jan 1, 1993
15.107
+0.18
1.21%
jan 1, 1994
12.382
-2.725
-18.04%
jan 1, 1995
11.242
-1.14
-9.21%
jan 1, 1996
8.654
-2.588
-23.02%
jan 1, 1997
8.784
+0.13
1.5%
jan 1, 1998
10.217
+1.433
16.31%
jan 1, 1999
9.23
-0.986
-9.66%
jan 1, 2000
9.387
+0.157
1.7%
jan 1, 2001
9.187
-0.2
-2.13%
jan 1, 2002
3.368
-5.82
-63.35%
jan 1, 2003
3.627
+0.259
7.69%
jan 1, 2004
4.03
+0.404
11.13%
jan 1, 2005
10.84
+6.81
168.96%
jan 1, 2006
9.147
-1.693
-15.62%
jan 1, 2007
4.631
-4.516
-49.37%
jan 1, 2008
6.94
+2.309
49.86%
jan 1, 2009
5.893
-1.047
-15.08%
jan 1, 2010
12.077
+6.183
104.92%
jan 1, 2011
12.441
+0.364
3.02%
jan 1, 2012
14.01
+1.569
12.61%
jan 1, 2013
12.667
-1.344
-9.59%
jan 1, 2014
11.554
-1.112
-8.78%
jan 1, 2015
12.524
+0.97
8.4%
jan 1, 2016
16.607
+4.082
32.6%
Ranking of countries by current statistics by years


Comments: