29
/
en
AIzaSyAYiBZKx7MnpbEhh9jyipgxe19OcubqV5w
April 1, 2024
64252
Albania
ALB
true
2
1
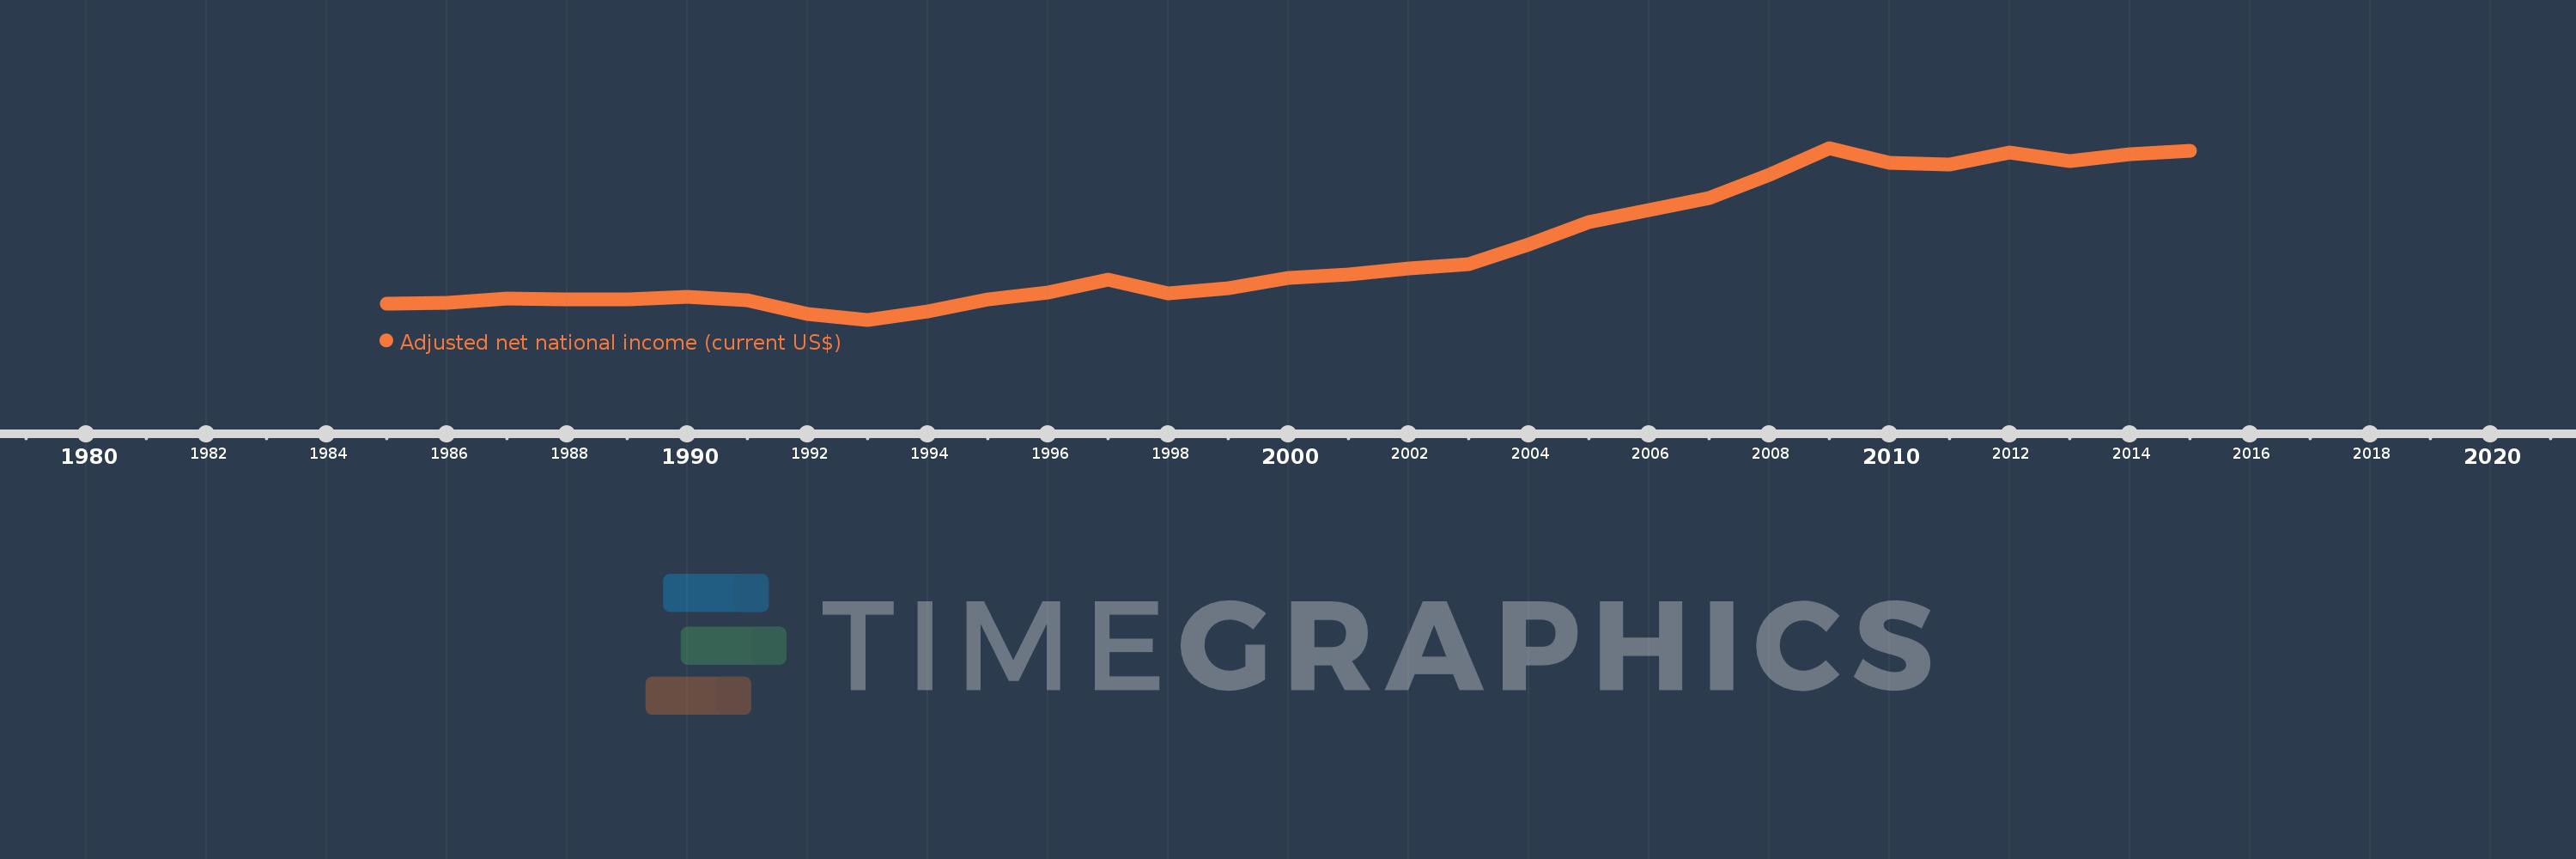
Adjusted net national income (current US$)
2015,2014,2013,2012,2011,2010,2009,2008,2007,2006,2005,2004,2003,2002,2001,2000,1999,1998,1997,1996,1995,1994,1993,1992,1991,1990,1989,1988,1987,1986,1985
This statistics in other country:
AfghanistanAlbaniaAlgeriaAngolaArab WorldArgentinaArmeniaAustraliaAustriaAzerbaijanBahamas, TheBahrainBangladeshBarbadosBelarusBelgiumBelizeBeninBhutanBoliviaBotswanaBrazilBrunei DarussalamBulgariaBurkina FasoBurundiCabo VerdeCambodiaCameroonCanadaCaribbean small statesCentral African RepublicCentral Europe and the BalticsChadChileChinaColombiaComorosCongo, Dem. Rep.Congo, Rep.Costa RicaCote d'IvoireCroatiaCubaCyprusCzech RepublicDenmarkDjiboutiDominicaDominican RepublicEarly-demographic dividendEast Asia & PacificEast Asia & Pacific (excluding high income)East Asia & Pacific (IDA & IBRD countries)EcuadorEgypt, Arab Rep.El SalvadorEquatorial GuineaEritreaEstoniaEthiopiaEuro areaEurope & Central AsiaEurope & Central Asia (excluding high income)Europe & Central Asia (IDA & IBRD countries)European UnionFijiFinlandFragile and conflict affected situationsFranceGabonGambia, TheGeorgiaGermanyGhanaGreeceGuatemalaGuineaGuinea-BissauGuyanaHaitiHeavily indebted poor countries (HIPC)High incomeHondurasHong Kong SAR, ChinaHungaryIBRD onlyIcelandIDA & IBRD totalIDA blendIDA onlyIDA totalIndiaIndonesiaIran, Islamic Rep.IraqIrelandIsraelItalyJamaicaJapanJordanKazakhstanKenyaKiribatiKorea, Rep.KuwaitKyrgyz RepublicLao PDRLate-demographic dividendLatin America & Caribbean Latin America & Caribbean (excluding high income)Latin America & the Caribbean (IDA & IBRD countries)LatviaLeast developed countries: UN classificationLebanonLesothoLiberiaLibyaLithuaniaLow & middle incomeLow incomeLower middle incomeLuxembourgMacedonia, FYRMadagascarMalawiMalaysiaMaldivesMaliMauritaniaMauritiusMexicoMiddle East & North AfricaMiddle East & North Africa (excluding high income)Middle East & North Africa (IDA & IBRD countries)Middle incomeMoldovaMongoliaMoroccoMozambiqueMyanmarNamibiaNepalNetherlandsNew ZealandNicaraguaNigerNigeriaNorth AmericaNorwayOECD membersOmanOther small statesPacific island small statesPakistanPanamaPapua New GuineaParaguayPeruPhilippinesPolandPortugalPost-demographic dividendPre-demographic dividendQatarRomaniaRussian FederationRwandaSamoaSao Tome and PrincipeSaudi ArabiaSenegalSeychellesSierra LeoneSingaporeSlovak RepublicSloveniaSmall statesSolomon IslandsSouth AfricaSouth AsiaSouth Asia (IDA & IBRD)SpainSri LankaSt. LuciaSt. Vincent and the GrenadinesSub-Saharan Africa Sub-Saharan Africa (excluding high income)Sub-Saharan Africa (IDA & IBRD countries)SudanSurinameSwazilandSwedenSwitzerlandSyrian Arab RepublicTajikistanTanzaniaThailandTogoTongaTrinidad and TobagoTunisiaTurkeyTurkmenistanUgandaUkraineUnited Arab EmiratesUnited KingdomUnited StatesUpper middle incomeUruguayUzbekistanVanuatuVenezuela, RBVietnamWorldYemen, Rep.ZambiaZimbabwe Timeline:
This timeline shows a graph from 1985 to 2015 of Albania. No data until 1984. Number of actual observations by date: 31.
Source name:
World Development Indicators
Source organization:
World Bank staff estimates based on sources and methods in World Bank's "The Changing Wealth of Nations: Measuring Sustainable Development in the New Millennium" (2011).
Categories, topics:
Economy & Growth
Last updated:
apr 23, 2017
Indicators value changes by year
Minimum:
539.394 mln
jan 1, 1993
Maximum:
11.21 bln
jan 1, 2009
At the date of observation
Value
Absolute change
Change from previous value
jan 1, 1985
1.539 bln
+1.539 bln
0.0%
jan 1, 1986
1.606 bln
+67.671 mln
4.4%
jan 1, 1987
1.859 bln
+252.605 mln
15.73%
jan 1, 1988
1.829 bln
-30.062 mln
-1.62%
jan 1, 1989
1.791 bln
-37.481 mln
-2.05%
jan 1, 1990
1.964 bln
+173.178 mln
9.67%
jan 1, 1991
1.756 bln
-208.245 mln
-10.6%
jan 1, 1992
907.708 mln
-848.49 mln
-48.31%
jan 1, 1993
539.394 mln
-368.314 mln
-40.58%
jan 1, 1994
1.079 bln
+539.91 mln
100.1%
jan 1, 1995
1.789 bln
+709.199 mln
65.71%
jan 1, 1996
2.215 bln
+426.179 mln
23.83%
jan 1, 1997
3.045 bln
+830.817 mln
37.51%
jan 1, 1998
2.164 bln
-881.403 mln
-28.94%
jan 1, 1999
2.498 bln
+333.492 mln
15.41%
jan 1, 2000
3.116 bln
+618.066 mln
24.75%
jan 1, 2001
3.328 bln
+212.477 mln
6.82%
jan 1, 2002
3.713 bln
+384.761 mln
11.56%
jan 1, 2003
4.017 bln
+304.277 mln
8.2%
jan 1, 2004
5.232 bln
+1.215 bln
30.24%
jan 1, 2005
6.612 bln
+1.38 bln
26.39%
jan 1, 2006
7.33 bln
+718.124 mln
10.86%
jan 1, 2007
8.117 bln
+786.281 mln
10.73%
jan 1, 2008
9.545 bln
+1.428 bln
17.59%
jan 1, 2009
11.21 bln
+1.666 bln
17.45%
jan 1, 2010
10.3 bln
-910.031 mln
-8.12%
jan 1, 2011
10.169 bln
-130.792 mln
-1.27%
jan 1, 2012
10.925 bln
+755.32 mln
7.43%
jan 1, 2013
10.373 bln
-551.856 mln
-5.05%
jan 1, 2014
10.832 bln
+459.579 mln
4.43%
jan 1, 2015
11.01 bln
+178.122 mln
1.64%
Ranking of countries by current statistics by years


Comments: