29
/
en
AIzaSyAYiBZKx7MnpbEhh9jyipgxe19OcubqV5w
April 1, 2024
44014
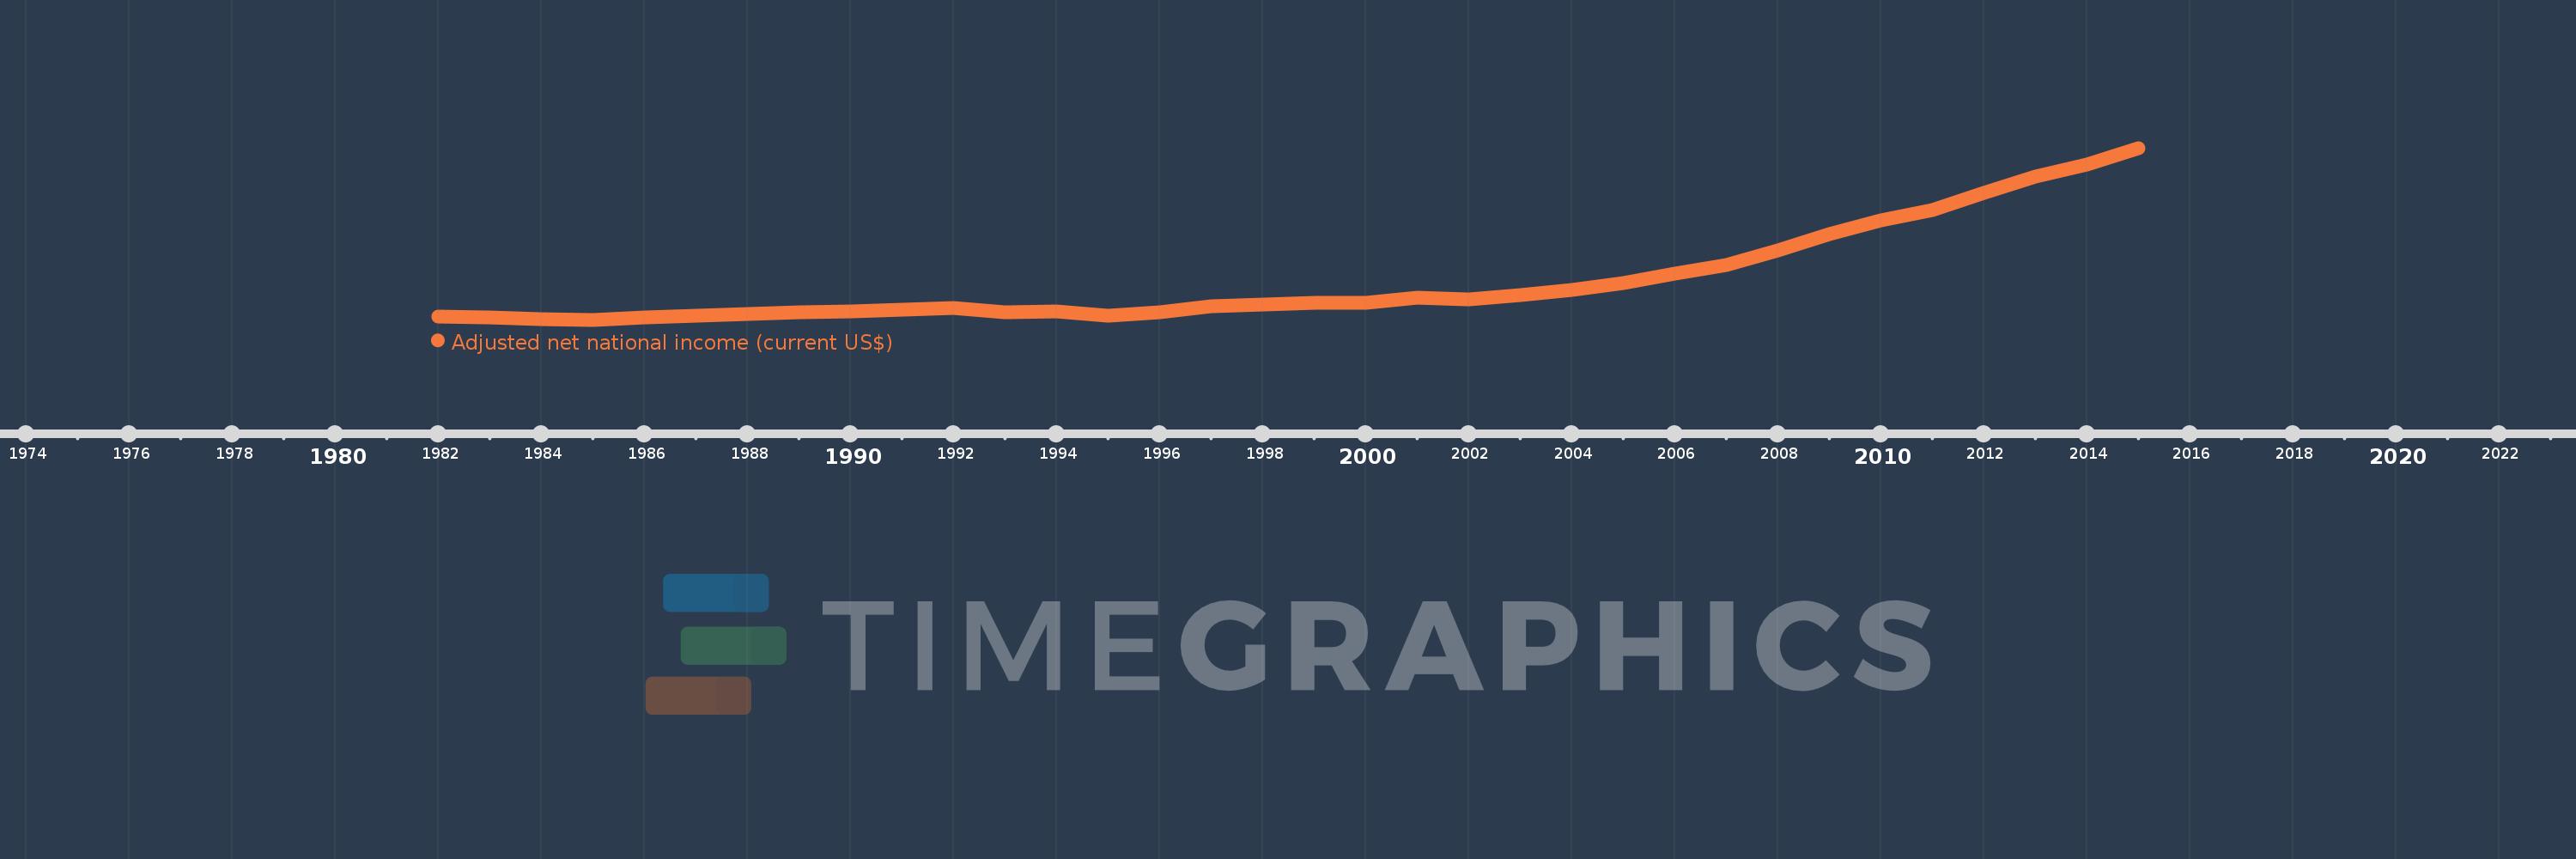
Least developed countries: UN classification
LDC
false
2
1
Adjusted net national income (current US$)
2015,2014,2013,2012,2011,2010,2009,2008,2007,2006,2005,2004,2003,2002,2001,2000,1999,1998,1997,1996,1995,1994,1993,1992,1991,1990,1989,1988,1987,1986,1985,1984,1983,1982
This statistics in other country:
AfghanistanAlbaniaAlgeriaAngolaArab WorldArgentinaArmeniaAustraliaAustriaAzerbaijanBahamas, TheBahrainBangladeshBarbadosBelarusBelgiumBelizeBeninBhutanBoliviaBotswanaBrazilBrunei DarussalamBulgariaBurkina FasoBurundiCabo VerdeCambodiaCameroonCanadaCaribbean small statesCentral African RepublicCentral Europe and the BalticsChadChileChinaColombiaComorosCongo, Dem. Rep.Congo, Rep.Costa RicaCote d'IvoireCroatiaCubaCyprusCzech RepublicDenmarkDjiboutiDominicaDominican RepublicEarly-demographic dividendEast Asia & PacificEast Asia & Pacific (excluding high income)East Asia & Pacific (IDA & IBRD countries)EcuadorEgypt, Arab Rep.El SalvadorEquatorial GuineaEritreaEstoniaEthiopiaEuro areaEurope & Central AsiaEurope & Central Asia (excluding high income)Europe & Central Asia (IDA & IBRD countries)European UnionFijiFinlandFragile and conflict affected situationsFranceGabonGambia, TheGeorgiaGermanyGhanaGreeceGuatemalaGuineaGuinea-BissauGuyanaHaitiHeavily indebted poor countries (HIPC)High incomeHondurasHong Kong SAR, ChinaHungaryIBRD onlyIcelandIDA & IBRD totalIDA blendIDA onlyIDA totalIndiaIndonesiaIran, Islamic Rep.IraqIrelandIsraelItalyJamaicaJapanJordanKazakhstanKenyaKiribatiKorea, Rep.KuwaitKyrgyz RepublicLao PDRLate-demographic dividendLatin America & Caribbean Latin America & Caribbean (excluding high income)Latin America & the Caribbean (IDA & IBRD countries)LatviaLeast developed countries: UN classificationLebanonLesothoLiberiaLibyaLithuaniaLow & middle incomeLow incomeLower middle incomeLuxembourgMacedonia, FYRMadagascarMalawiMalaysiaMaldivesMaliMauritaniaMauritiusMexicoMiddle East & North AfricaMiddle East & North Africa (excluding high income)Middle East & North Africa (IDA & IBRD countries)Middle incomeMoldovaMongoliaMoroccoMozambiqueMyanmarNamibiaNepalNetherlandsNew ZealandNicaraguaNigerNigeriaNorth AmericaNorwayOECD membersOmanOther small statesPacific island small statesPakistanPanamaPapua New GuineaParaguayPeruPhilippinesPolandPortugalPost-demographic dividendPre-demographic dividendQatarRomaniaRussian FederationRwandaSamoaSao Tome and PrincipeSaudi ArabiaSenegalSeychellesSierra LeoneSingaporeSlovak RepublicSloveniaSmall statesSolomon IslandsSouth AfricaSouth AsiaSouth Asia (IDA & IBRD)SpainSri LankaSt. LuciaSt. Vincent and the GrenadinesSub-Saharan Africa Sub-Saharan Africa (excluding high income)Sub-Saharan Africa (IDA & IBRD countries)SudanSurinameSwazilandSwedenSwitzerlandSyrian Arab RepublicTajikistanTanzaniaThailandTogoTongaTrinidad and TobagoTunisiaTurkeyTurkmenistanUgandaUkraineUnited Arab EmiratesUnited KingdomUnited StatesUpper middle incomeUruguayUzbekistanVanuatuVenezuela, RBVietnamWorldYemen, Rep.ZambiaZimbabwe Timeline:
This timeline shows a graph from 1982 to 2015 of Least developed countries: UN classification. No data until 1981. Number of actual observations by date: 34.
Source name:
World Development Indicators
Source organization:
World Bank staff estimates based on sources and methods in World Bank's "The Changing Wealth of Nations: Measuring Sustainable Development in the New Millennium" (2011).
Categories, topics:
Economy & Growth
Last updated:
apr 23, 2017
Indicators value changes by year
Minimum:
99.554 bln
jan 1, 1985
Maximum:
753.352 bln
jan 1, 2015
At the date of observation
Value
Absolute change
Change from previous value
jan 1, 1982
110.273 bln
+110.273 bln
0.0%
jan 1, 1983
108.53 bln
-1.743 bln
-1.58%
jan 1, 1984
103.383 bln
-5.147 bln
-4.74%
jan 1, 1985
99.554 bln
-3.828 bln
-3.7%
jan 1, 1986
108.334 bln
+8.78 bln
8.82%
jan 1, 1987
115.403 bln
+7.068 bln
6.52%
jan 1, 1988
119.841 bln
+4.438 bln
3.85%
jan 1, 1989
129.542 bln
+9.701 bln
8.09%
jan 1, 1990
130.065 bln
+523.363 mln
0.4%
jan 1, 1991
136.404 bln
+6.339 bln
4.87%
jan 1, 1992
143.466 bln
+7.062 bln
5.18%
jan 1, 1993
129.057 bln
-14.409 bln
-10.04%
jan 1, 1994
132.021 bln
+2.964 bln
2.3%
jan 1, 1995
115.023 bln
-16.998 bln
-12.88%
jan 1, 1996
129.018 bln
+13.996 bln
12.17%
jan 1, 1997
150.812 bln
+21.794 bln
16.89%
jan 1, 1998
158.911 bln
+8.099 bln
5.37%
jan 1, 1999
162.428 bln
+3.517 bln
2.21%
jan 1, 2000
164.856 bln
+2.428 bln
1.5%
jan 1, 2001
184.142 bln
+19.286 bln
11.7%
jan 1, 2002
176.372 bln
-7.77 bln
-4.22%
jan 1, 2003
192.292 bln
+15.92 bln
9.03%
jan 1, 2004
212.321 bln
+20.029 bln
10.42%
jan 1, 2005
240.324 bln
+28.003 bln
13.19%
jan 1, 2006
274.255 bln
+33.931 bln
14.12%
jan 1, 2007
309.289 bln
+35.034 bln
12.77%
jan 1, 2008
364.268 bln
+54.978 bln
17.78%
jan 1, 2009
426.193 bln
+61.925 bln
17.0%
jan 1, 2010
477.896 bln
+51.704 bln
12.13%
jan 1, 2011
515.962 bln
+38.065 bln
7.97%
jan 1, 2012
581.544 bln
+65.582 bln
12.71%
jan 1, 2013
645.836 bln
+64.292 bln
11.06%
jan 1, 2014
688.68 bln
+42.844 bln
6.63%
jan 1, 2015
753.352 bln
+64.671 bln
9.39%
Ranking of countries by current statistics by years


Comments: