29
/
en
AIzaSyAYiBZKx7MnpbEhh9jyipgxe19OcubqV5w
April 1, 2024
264167
Togo
TGO
true
2
1
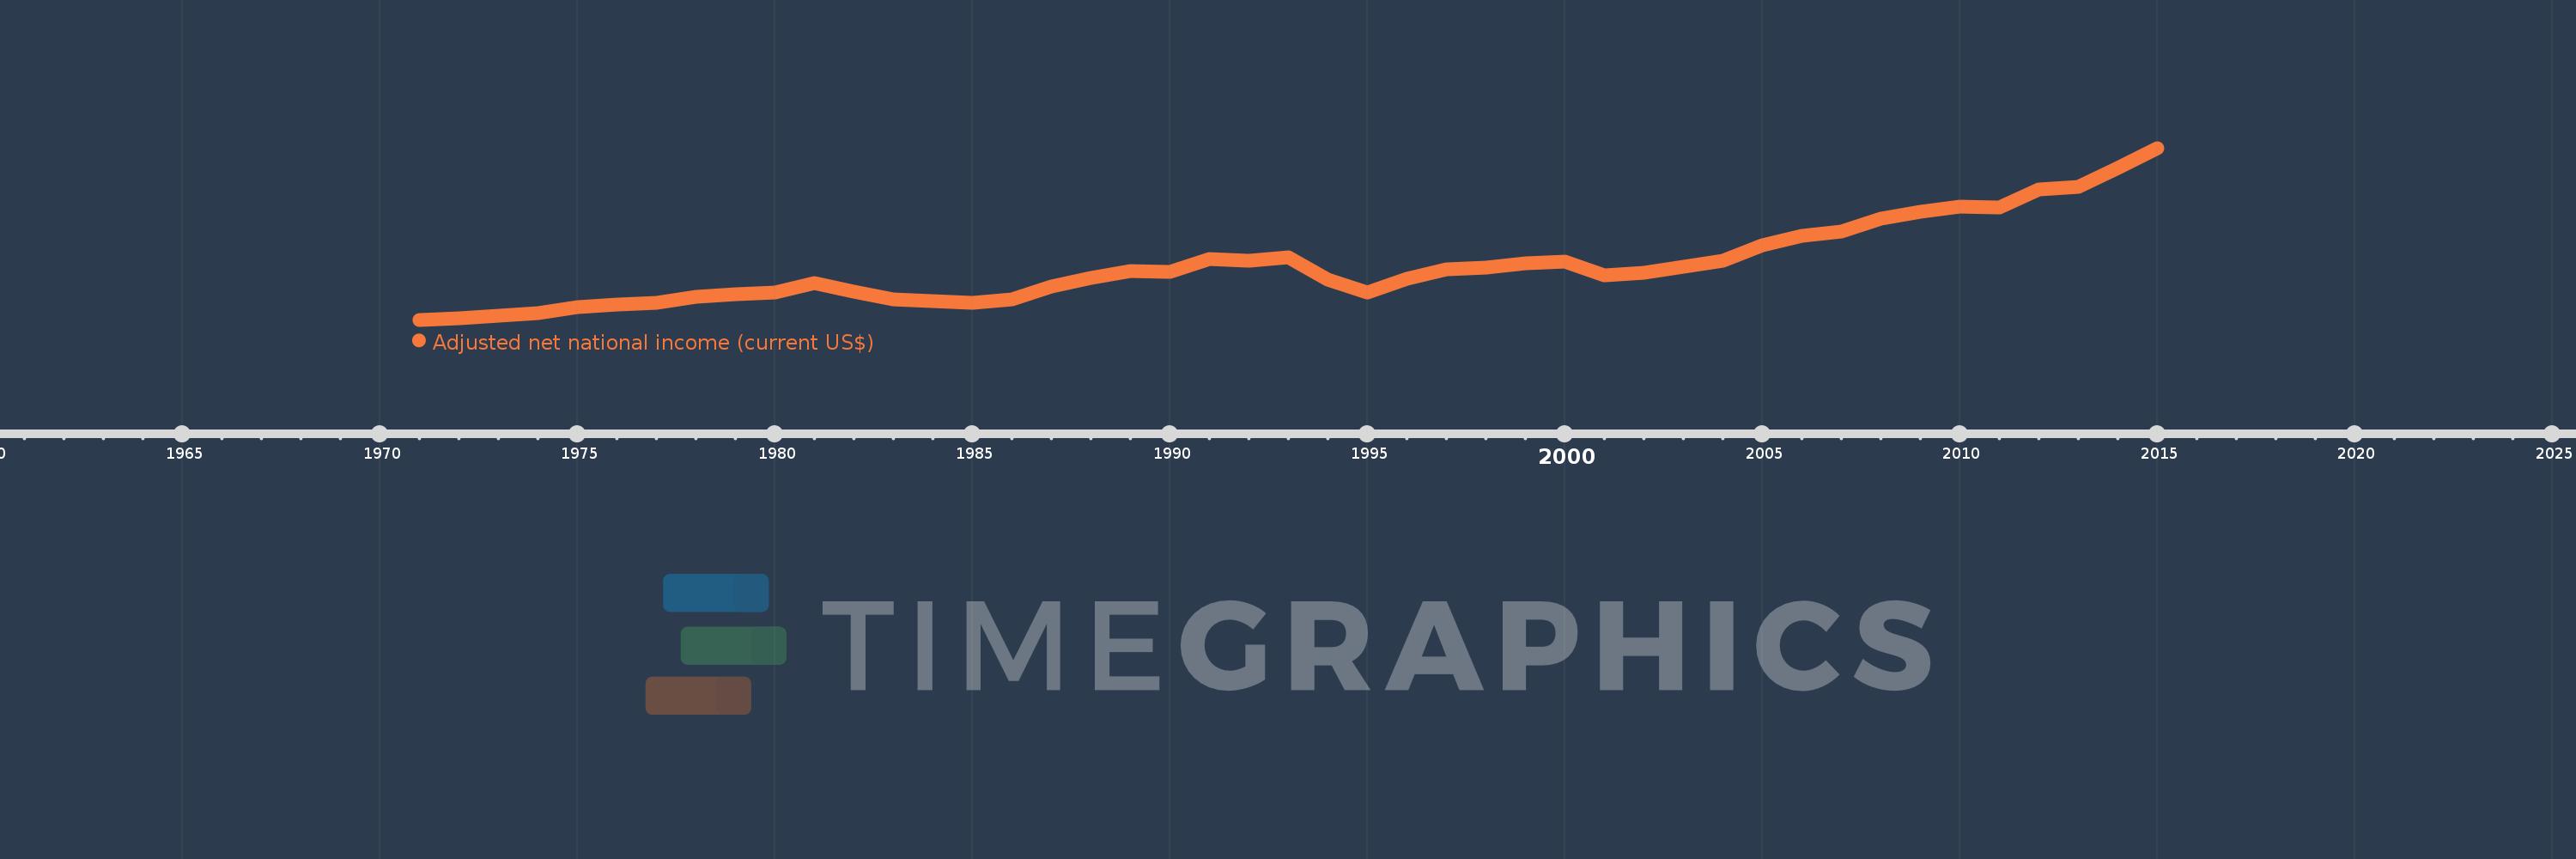
Adjusted net national income (current US$)
2015,2014,2013,2012,2011,2010,2009,2008,2007,2006,2005,2004,2003,2002,2001,2000,1999,1998,1997,1996,1995,1994,1993,1992,1991,1990,1989,1988,1987,1986,1985,1984,1983,1982,1981,1980,1979,1978,1977,1976,1975,1974,1973,1972,1971
This statistics in other country:
AfghanistanAlbaniaAlgeriaAngolaArab WorldArgentinaArmeniaAustraliaAustriaAzerbaijanBahamas, TheBahrainBangladeshBarbadosBelarusBelgiumBelizeBeninBhutanBoliviaBotswanaBrazilBrunei DarussalamBulgariaBurkina FasoBurundiCabo VerdeCambodiaCameroonCanadaCaribbean small statesCentral African RepublicCentral Europe and the BalticsChadChileChinaColombiaComorosCongo, Dem. Rep.Congo, Rep.Costa RicaCote d'IvoireCroatiaCubaCyprusCzech RepublicDenmarkDjiboutiDominicaDominican RepublicEarly-demographic dividendEast Asia & PacificEast Asia & Pacific (excluding high income)East Asia & Pacific (IDA & IBRD countries)EcuadorEgypt, Arab Rep.El SalvadorEquatorial GuineaEritreaEstoniaEthiopiaEuro areaEurope & Central AsiaEurope & Central Asia (excluding high income)Europe & Central Asia (IDA & IBRD countries)European UnionFijiFinlandFragile and conflict affected situationsFranceGabonGambia, TheGeorgiaGermanyGhanaGreeceGuatemalaGuineaGuinea-BissauGuyanaHaitiHeavily indebted poor countries (HIPC)High incomeHondurasHong Kong SAR, ChinaHungaryIBRD onlyIcelandIDA & IBRD totalIDA blendIDA onlyIDA totalIndiaIndonesiaIran, Islamic Rep.IraqIrelandIsraelItalyJamaicaJapanJordanKazakhstanKenyaKiribatiKorea, Rep.KuwaitKyrgyz RepublicLao PDRLate-demographic dividendLatin America & Caribbean Latin America & Caribbean (excluding high income)Latin America & the Caribbean (IDA & IBRD countries)LatviaLeast developed countries: UN classificationLebanonLesothoLiberiaLibyaLithuaniaLow & middle incomeLow incomeLower middle incomeLuxembourgMacedonia, FYRMadagascarMalawiMalaysiaMaldivesMaliMauritaniaMauritiusMexicoMiddle East & North AfricaMiddle East & North Africa (excluding high income)Middle East & North Africa (IDA & IBRD countries)Middle incomeMoldovaMongoliaMoroccoMozambiqueMyanmarNamibiaNepalNetherlandsNew ZealandNicaraguaNigerNigeriaNorth AmericaNorwayOECD membersOmanOther small statesPacific island small statesPakistanPanamaPapua New GuineaParaguayPeruPhilippinesPolandPortugalPost-demographic dividendPre-demographic dividendQatarRomaniaRussian FederationRwandaSamoaSao Tome and PrincipeSaudi ArabiaSenegalSeychellesSierra LeoneSingaporeSlovak RepublicSloveniaSmall statesSolomon IslandsSouth AfricaSouth AsiaSouth Asia (IDA & IBRD)SpainSri LankaSt. LuciaSt. Vincent and the GrenadinesSub-Saharan Africa Sub-Saharan Africa (excluding high income)Sub-Saharan Africa (IDA & IBRD countries)SudanSurinameSwazilandSwedenSwitzerlandSyrian Arab RepublicTajikistanTanzaniaThailandTogoTongaTrinidad and TobagoTunisiaTurkeyTurkmenistanUgandaUkraineUnited Arab EmiratesUnited KingdomUnited StatesUpper middle incomeUruguayUzbekistanVanuatuVenezuela, RBVietnamWorldYemen, Rep.ZambiaZimbabwe Timeline:
This timeline shows a graph from 1971 to 2015 of Togo. No data until 1970. Number of actual observations by date: 45.
Source name:
World Development Indicators
Source organization:
World Bank staff estimates based on sources and methods in World Bank's "The Changing Wealth of Nations: Measuring Sustainable Development in the New Millennium" (2011).
Categories, topics:
Economy & Growth
Last updated:
apr 23, 2017
Indicators value changes by year
Minimum:
223.588 mln
jan 1, 1971
Maximum:
3.517 bln
jan 1, 2015
At the date of observation
Value
Absolute change
Change from previous value
jan 1, 1971
223.588 mln
+223.588 mln
0.0%
jan 1, 1972
256.942 mln
+33.354 mln
14.92%
jan 1, 1973
296.16 mln
+39.218 mln
15.26%
jan 1, 1974
346.198 mln
+50.038 mln
16.9%
jan 1, 1975
464.985 mln
+118.787 mln
34.31%
jan 1, 1976
522.736 mln
+57.751 mln
12.42%
jan 1, 1977
540.362 mln
+17.627 mln
3.37%
jan 1, 1978
670.993 mln
+130.631 mln
24.17%
jan 1, 1979
711.284 mln
+40.291 mln
6.0%
jan 1, 1980
752.274 mln
+40.99 mln
5.76%
jan 1, 1981
924.629 mln
+172.355 mln
22.91%
jan 1, 1982
758.297 mln
-166.332 mln
-17.99%
jan 1, 1983
610.269 mln
-148.028 mln
-19.52%
jan 1, 1984
580.991 mln
-29.277 mln
-4.8%
jan 1, 1985
547.487 mln
-33.504 mln
-5.77%
jan 1, 1986
614.387 mln
+66.9 mln
12.22%
jan 1, 1987
868.453 mln
+254.066 mln
41.35%
jan 1, 1988
1.032 bln
+163.793 mln
18.86%
jan 1, 1989
1.156 bln
+123.821 mln
12.0%
jan 1, 1990
1.148 bln
-8.164 mln
-0.71%
jan 1, 1991
1.388 bln
+239.797 mln
20.89%
jan 1, 1992
1.347 bln
-40.702 mln
-2.93%
jan 1, 1993
1.427 bln
+79.767 mln
5.92%
jan 1, 1994
999.964 mln
-426.799 mln
-29.91%
jan 1, 1995
748.977 mln
-250.988 mln
-25.1%
jan 1, 1996
1.015 bln
+266.315 mln
35.56%
jan 1, 1997
1.188 bln
+172.878 mln
17.03%
jan 1, 1998
1.226 bln
+37.76 mln
3.18%
jan 1, 1999
1.306 bln
+79.672 mln
6.5%
jan 1, 2000
1.332 bln
+25.944 mln
1.99%
jan 1, 2001
1.081 bln
-250.811 mln
-18.84%
jan 1, 2002
1.125 bln
+44.008 mln
4.07%
jan 1, 2003
1.247 bln
+122.343 mln
10.88%
jan 1, 2004
1.362 bln
+115.21 mln
9.24%
jan 1, 2005
1.658 bln
+295.603 mln
21.7%
jan 1, 2006
1.828 bln
+170.285 mln
10.27%
jan 1, 2007
1.914 bln
+85.759 mln
4.69%
jan 1, 2008
2.154 bln
+240.082 mln
12.54%
jan 1, 2009
2.29 bln
+135.666 mln
6.3%
jan 1, 2010
2.385 bln
+95.012 mln
4.15%
jan 1, 2011
2.373 bln
-11.346 mln
-0.48%
jan 1, 2012
2.72 bln
+346.744 mln
14.61%
jan 1, 2013
2.772 bln
+52.086 mln
1.91%
jan 1, 2014
3.134 bln
+362.2 mln
13.07%
jan 1, 2015
3.517 bln
+382.283 mln
12.2%
Ranking of countries by current statistics by years


Comments: