29
/
en
AIzaSyAYiBZKx7MnpbEhh9jyipgxe19OcubqV5w
April 1, 2024
95729
Burundi
BDI
true
2
1
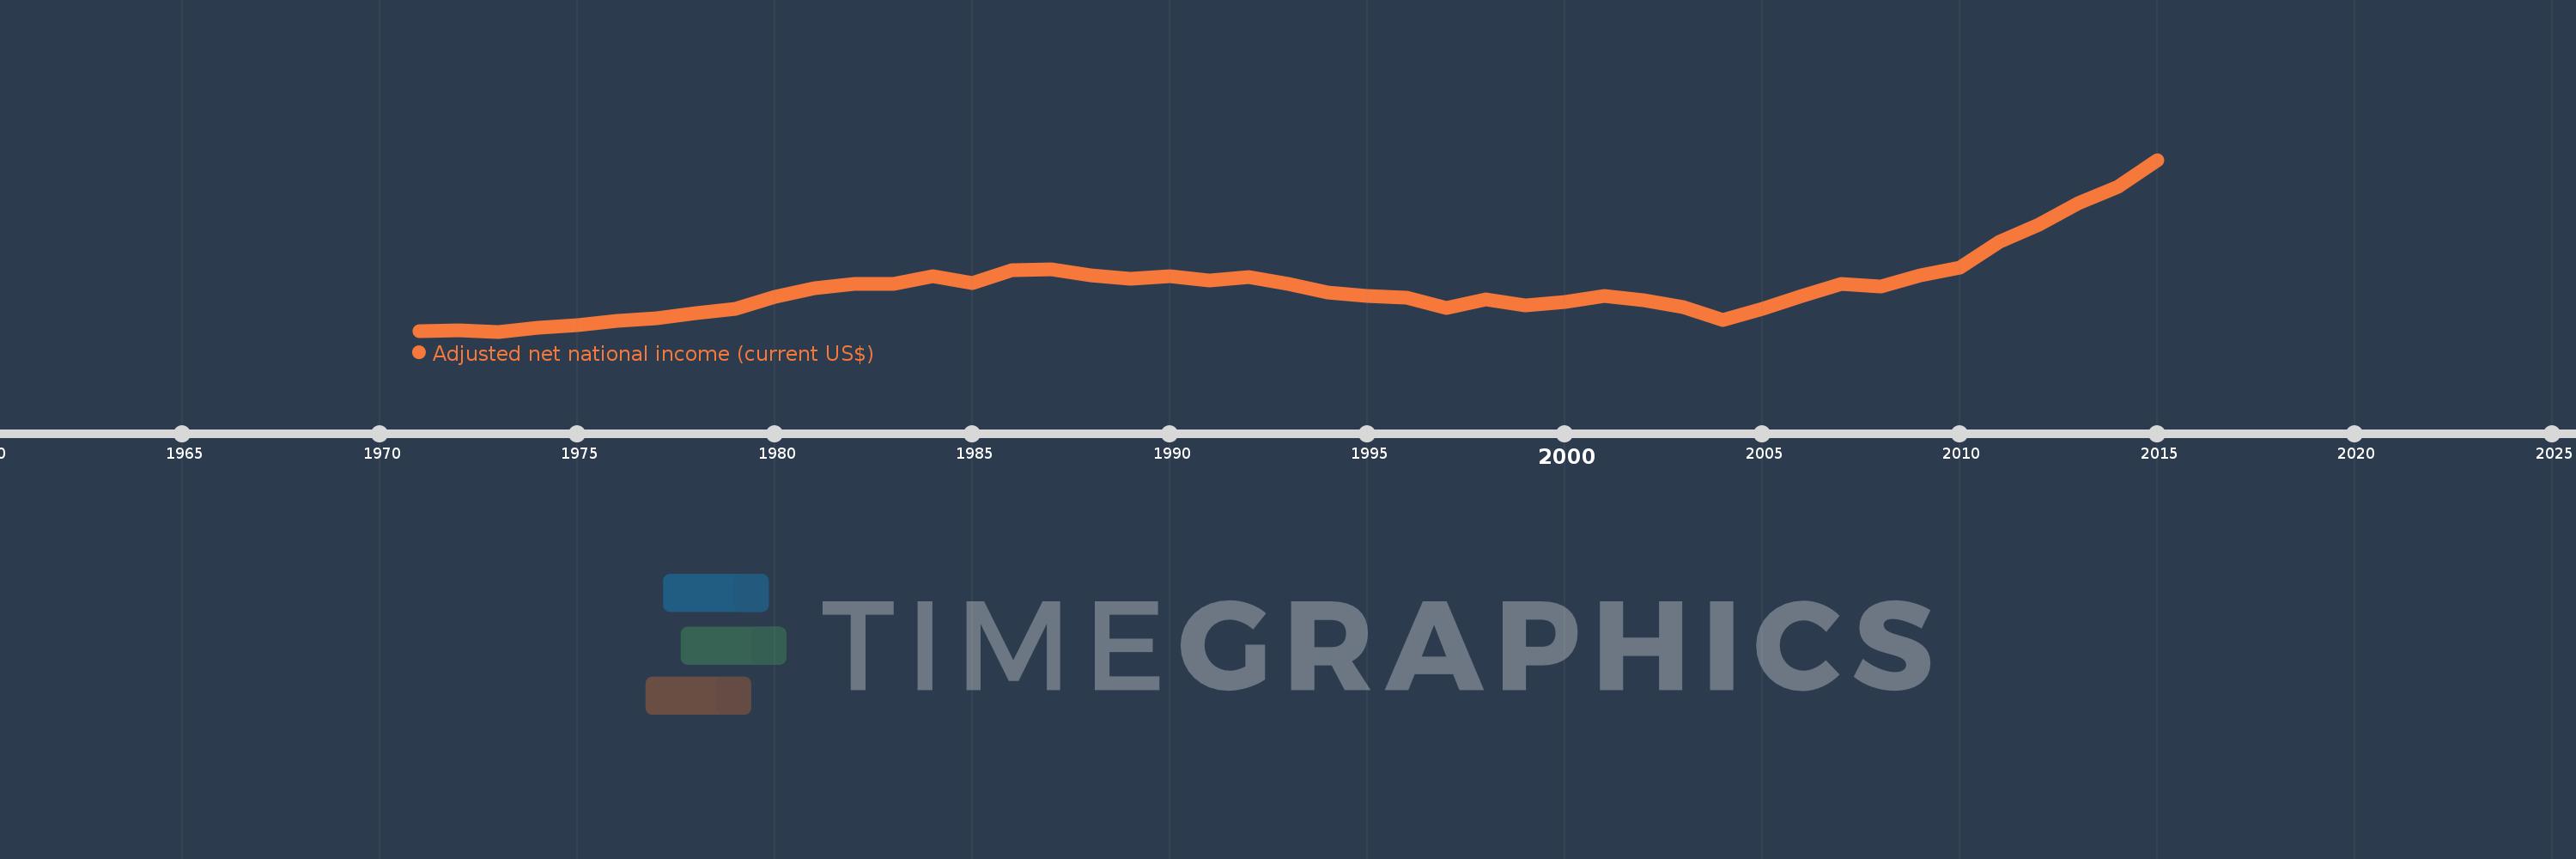
Adjusted net national income (current US$)
2015,2014,2013,2012,2011,2010,2009,2008,2007,2006,2005,2004,2003,2002,2001,2000,1999,1998,1997,1996,1995,1994,1993,1992,1991,1990,1989,1988,1987,1986,1985,1984,1983,1982,1981,1980,1979,1978,1977,1976,1975,1974,1973,1972,1971
This statistics in other country:
AfghanistanAlbaniaAlgeriaAngolaArab WorldArgentinaArmeniaAustraliaAustriaAzerbaijanBahamas, TheBahrainBangladeshBarbadosBelarusBelgiumBelizeBeninBhutanBoliviaBotswanaBrazilBrunei DarussalamBulgariaBurkina FasoBurundiCabo VerdeCambodiaCameroonCanadaCaribbean small statesCentral African RepublicCentral Europe and the BalticsChadChileChinaColombiaComorosCongo, Dem. Rep.Congo, Rep.Costa RicaCote d'IvoireCroatiaCubaCyprusCzech RepublicDenmarkDjiboutiDominicaDominican RepublicEarly-demographic dividendEast Asia & PacificEast Asia & Pacific (excluding high income)East Asia & Pacific (IDA & IBRD countries)EcuadorEgypt, Arab Rep.El SalvadorEquatorial GuineaEritreaEstoniaEthiopiaEuro areaEurope & Central AsiaEurope & Central Asia (excluding high income)Europe & Central Asia (IDA & IBRD countries)European UnionFijiFinlandFragile and conflict affected situationsFranceGabonGambia, TheGeorgiaGermanyGhanaGreeceGuatemalaGuineaGuinea-BissauGuyanaHaitiHeavily indebted poor countries (HIPC)High incomeHondurasHong Kong SAR, ChinaHungaryIBRD onlyIcelandIDA & IBRD totalIDA blendIDA onlyIDA totalIndiaIndonesiaIran, Islamic Rep.IraqIrelandIsraelItalyJamaicaJapanJordanKazakhstanKenyaKiribatiKorea, Rep.KuwaitKyrgyz RepublicLao PDRLate-demographic dividendLatin America & Caribbean Latin America & Caribbean (excluding high income)Latin America & the Caribbean (IDA & IBRD countries)LatviaLeast developed countries: UN classificationLebanonLesothoLiberiaLibyaLithuaniaLow & middle incomeLow incomeLower middle incomeLuxembourgMacedonia, FYRMadagascarMalawiMalaysiaMaldivesMaliMauritaniaMauritiusMexicoMiddle East & North AfricaMiddle East & North Africa (excluding high income)Middle East & North Africa (IDA & IBRD countries)Middle incomeMoldovaMongoliaMoroccoMozambiqueMyanmarNamibiaNepalNetherlandsNew ZealandNicaraguaNigerNigeriaNorth AmericaNorwayOECD membersOmanOther small statesPacific island small statesPakistanPanamaPapua New GuineaParaguayPeruPhilippinesPolandPortugalPost-demographic dividendPre-demographic dividendQatarRomaniaRussian FederationRwandaSamoaSao Tome and PrincipeSaudi ArabiaSenegalSeychellesSierra LeoneSingaporeSlovak RepublicSloveniaSmall statesSolomon IslandsSouth AfricaSouth AsiaSouth Asia (IDA & IBRD)SpainSri LankaSt. LuciaSt. Vincent and the GrenadinesSub-Saharan Africa Sub-Saharan Africa (excluding high income)Sub-Saharan Africa (IDA & IBRD countries)SudanSurinameSwazilandSwedenSwitzerlandSyrian Arab RepublicTajikistanTanzaniaThailandTogoTongaTrinidad and TobagoTunisiaTurkeyTurkmenistanUgandaUkraineUnited Arab EmiratesUnited KingdomUnited StatesUpper middle incomeUruguayUzbekistanVanuatuVenezuela, RBVietnamWorldYemen, Rep.ZambiaZimbabwe Timeline:
This timeline shows a graph from 1971 to 2015 of Burundi. No data until 1970. Number of actual observations by date: 45.
Source name:
World Development Indicators
Source organization:
World Bank staff estimates based on sources and methods in World Bank's "The Changing Wealth of Nations: Measuring Sustainable Development in the New Millennium" (2011).
Categories, topics:
Economy & Growth
Last updated:
apr 23, 2017
Indicators value changes by year
Minimum:
181.879 mln
jan 1, 1973
Maximum:
2.211 bln
jan 1, 2015
At the date of observation
Value
Absolute change
Change from previous value
jan 1, 1971
182.54 mln
+182.54 mln
0.0%
jan 1, 1972
192.193 mln
+9.653 mln
5.29%
jan 1, 1973
181.879 mln
-10.314 mln
-5.37%
jan 1, 1974
223.82 mln
+41.941 mln
23.06%
jan 1, 1975
256.147 mln
+32.327 mln
14.44%
jan 1, 1976
310.467 mln
+54.32 mln
21.21%
jan 1, 1977
334.52 mln
+24.053 mln
7.75%
jan 1, 1978
404.894 mln
+70.374 mln
21.04%
jan 1, 1979
454.344 mln
+49.45 mln
12.21%
jan 1, 1980
589.025 mln
+134.681 mln
29.64%
jan 1, 1981
695.044 mln
+106.019 mln
18.0%
jan 1, 1982
748.767 mln
+53.724 mln
7.73%
jan 1, 1983
745.65 mln
-3.118 mln
-0.42%
jan 1, 1984
836.768 mln
+91.118 mln
12.22%
jan 1, 1985
754.421 mln
-82.347 mln
-9.84%
jan 1, 1986
903.558 mln
+149.137 mln
19.77%
jan 1, 1987
915.14 mln
+11.582 mln
1.28%
jan 1, 1988
848.495 mln
-66.645 mln
-7.28%
jan 1, 1989
801.903 mln
-46.591 mln
-5.49%
jan 1, 1990
831.602 mln
+29.698 mln
3.7%
jan 1, 1991
787.76 mln
-43.842 mln
-5.27%
jan 1, 1992
823.655 mln
+35.895 mln
4.56%
jan 1, 1993
747.214 mln
-76.441 mln
-9.28%
jan 1, 1994
646.563 mln
-100.651 mln
-13.47%
jan 1, 1995
604.585 mln
-41.978 mln
-6.49%
jan 1, 1996
584.417 mln
-20.167 mln
-3.34%
jan 1, 1997
462.945 mln
-121.472 mln
-20.79%
jan 1, 1998
566.103 mln
+103.158 mln
22.28%
jan 1, 1999
495.843 mln
-70.26 mln
-12.41%
jan 1, 2000
531.896 mln
+36.053 mln
7.27%
jan 1, 2001
601.292 mln
+69.396 mln
13.05%
jan 1, 2002
547.382 mln
-53.909 mln
-8.97%
jan 1, 2003
467.83 mln
-79.552 mln
-14.53%
jan 1, 2004
314.498 mln
-153.332 mln
-32.78%
jan 1, 2005
450.519 mln
+136.02 mln
43.25%
jan 1, 2006
603.795 mln
+153.277 mln
34.02%
jan 1, 2007
745.318 mln
+141.522 mln
23.44%
jan 1, 2008
717.931 mln
-27.386 mln
-3.67%
jan 1, 2009
844.381 mln
+126.45 mln
17.61%
jan 1, 2010
935.006 mln
+90.624 mln
10.73%
jan 1, 2011
1.239 bln
+303.972 mln
32.51%
jan 1, 2012
1.448 bln
+209.054 mln
16.87%
jan 1, 2013
1.701 bln
+253.193 mln
17.49%
jan 1, 2014
1.891 bln
+190.091 mln
11.17%
jan 1, 2015
2.211 bln
+319.974 mln
16.92%
Ranking of countries by current statistics by years


Comments: