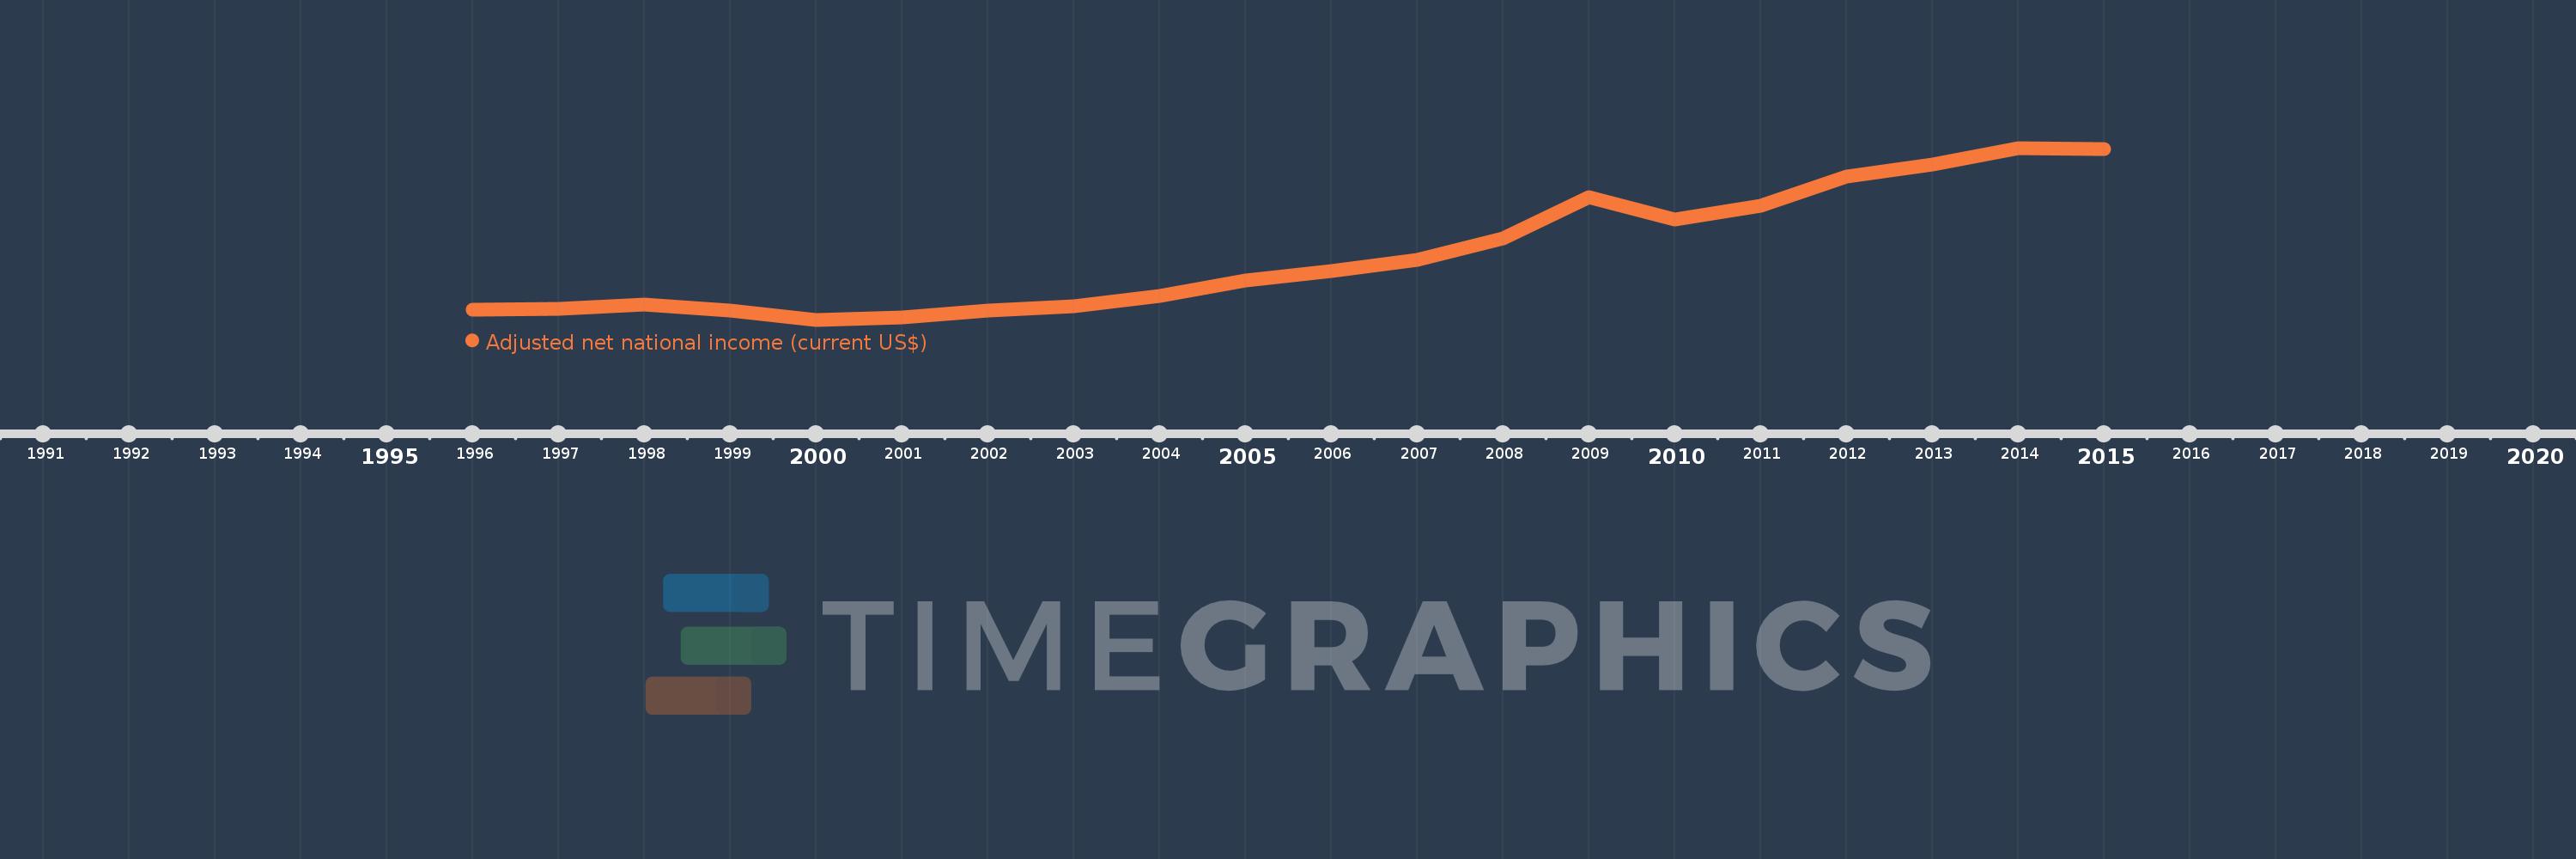
This timeline shows a graph from 1996 to 2015 of Moldova. No data until 1995. Number of actual observations by date: 20.
Source name:
World Development Indicators
Source organization:
World Bank staff estimates based on sources and methods in World Bank's "The Changing Wealth of Nations: Measuring Sustainable Development in the New Millennium" (2011).
Categories, topics:
Economy & Growth
Last updated:
apr 23, 2017
Indicators value changes by year
Meaning:
3.652 bln
Minimum:
947.588 mln
jan 1, 2000
Maximum:
8.089 bln
jan 1, 2014
At the date of observation
Value
Absolute change
Change from the previous value
jan 1, 1996
1.358 bln
+1.358 bln
0.0%
jan 1, 1997
1.392 bln
+34.68 mln
2.55%
jan 1, 1998
1.588 bln
+195.279 mln
14.03%
jan 1, 1999
1.336 bln
-251.571 mln
-15.85%
jan 1, 2000
947.588 mln
-388.391 mln
-29.07%
jan 1, 2001
1.055 bln
+107.248 mln
11.32%
jan 1, 2002
1.313 bln
+257.735 mln
24.43%
jan 1, 2003
1.506 bln
+193.293 mln
14.73%
jan 1, 2004
1.925 bln
+418.895 mln
27.82%
jan 1, 2005
2.588 bln
+663.738 mln
34.48%
jan 1, 2006
2.986 bln
+397.118 mln
15.34%
jan 1, 2007
3.423 bln
+437.281 mln
14.65%
jan 1, 2008
4.332 bln
+909.284 mln
26.56%
jan 1, 2009
6.029 bln
+1.696 bln
39.16%
jan 1, 2010
5.132 bln
-896.5 mln
-14.87%
jan 1, 2011
5.697 bln
+564.863 mln
11.01%
jan 1, 2012
6.908 bln
+1.211 bln
21.25%
jan 1, 2013
7.403 bln
+494.993 mln
7.17%
jan 1, 2014
8.089 bln
+686.464 mln
9.27%
jan 1, 2015
8.034 bln
-54.751 mln
-0.68%
Ranking of countries by current statistics by years
