29
/
en
AIzaSyAYiBZKx7MnpbEhh9jyipgxe19OcubqV5w
April 1, 2024
267579
Tunisia
TUN
true
2
1
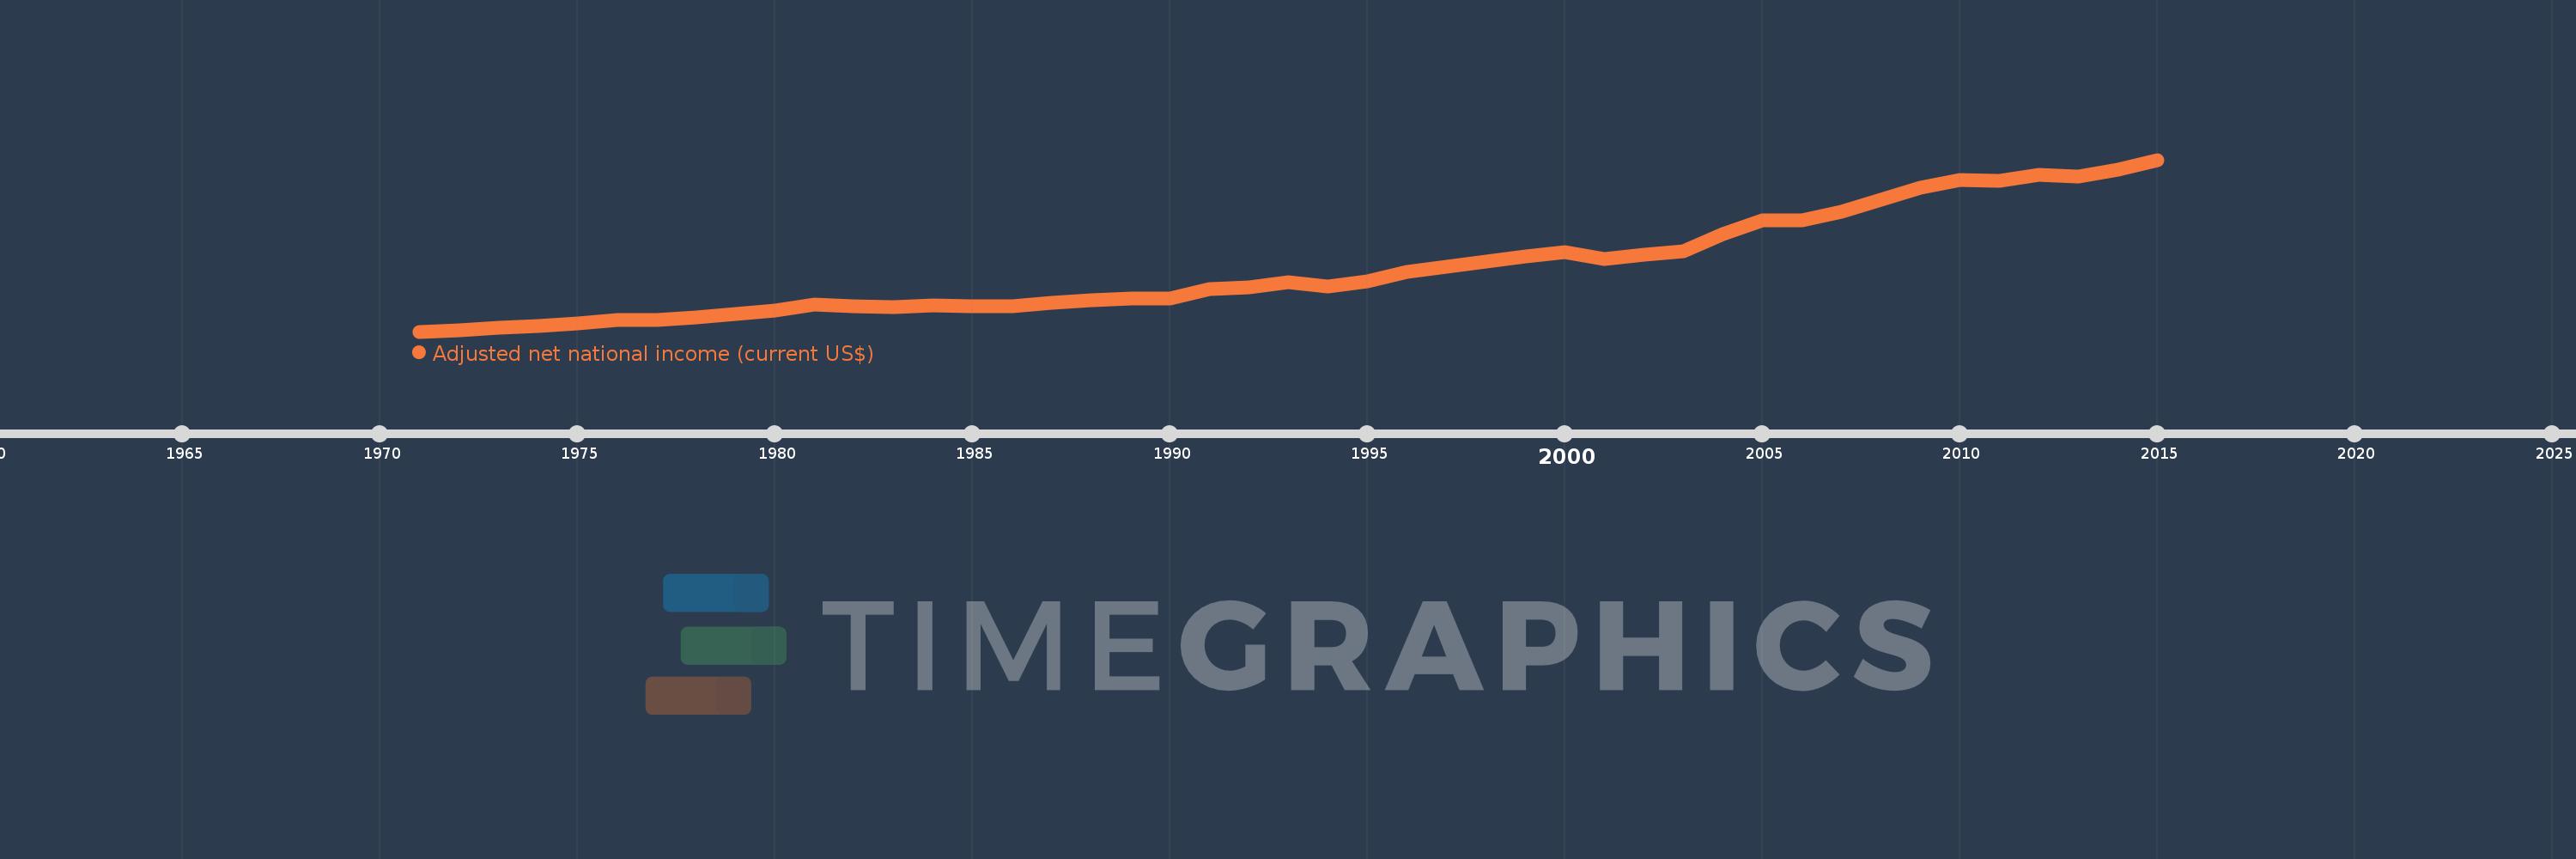
Adjusted net national income (current US$)
2015,2014,2013,2012,2011,2010,2009,2008,2007,2006,2005,2004,2003,2002,2001,2000,1999,1998,1997,1996,1995,1994,1993,1992,1991,1990,1989,1988,1987,1986,1985,1984,1983,1982,1981,1980,1979,1978,1977,1976,1975,1974,1973,1972,1971
This statistics in other country:
AfghanistanAlbaniaAlgeriaAngolaArab WorldArgentinaArmeniaAustraliaAustriaAzerbaijanBahamas, TheBahrainBangladeshBarbadosBelarusBelgiumBelizeBeninBhutanBoliviaBotswanaBrazilBrunei DarussalamBulgariaBurkina FasoBurundiCabo VerdeCambodiaCameroonCanadaCaribbean small statesCentral African RepublicCentral Europe and the BalticsChadChileChinaColombiaComorosCongo, Dem. Rep.Congo, Rep.Costa RicaCote d'IvoireCroatiaCubaCyprusCzech RepublicDenmarkDjiboutiDominicaDominican RepublicEarly-demographic dividendEast Asia & PacificEast Asia & Pacific (excluding high income)East Asia & Pacific (IDA & IBRD countries)EcuadorEgypt, Arab Rep.El SalvadorEquatorial GuineaEritreaEstoniaEthiopiaEuro areaEurope & Central AsiaEurope & Central Asia (excluding high income)Europe & Central Asia (IDA & IBRD countries)European UnionFijiFinlandFragile and conflict affected situationsFranceGabonGambia, TheGeorgiaGermanyGhanaGreeceGuatemalaGuineaGuinea-BissauGuyanaHaitiHeavily indebted poor countries (HIPC)High incomeHondurasHong Kong SAR, ChinaHungaryIBRD onlyIcelandIDA & IBRD totalIDA blendIDA onlyIDA totalIndiaIndonesiaIran, Islamic Rep.IraqIrelandIsraelItalyJamaicaJapanJordanKazakhstanKenyaKiribatiKorea, Rep.KuwaitKyrgyz RepublicLao PDRLate-demographic dividendLatin America & Caribbean Latin America & Caribbean (excluding high income)Latin America & the Caribbean (IDA & IBRD countries)LatviaLeast developed countries: UN classificationLebanonLesothoLiberiaLibyaLithuaniaLow & middle incomeLow incomeLower middle incomeLuxembourgMacedonia, FYRMadagascarMalawiMalaysiaMaldivesMaliMauritaniaMauritiusMexicoMiddle East & North AfricaMiddle East & North Africa (excluding high income)Middle East & North Africa (IDA & IBRD countries)Middle incomeMoldovaMongoliaMoroccoMozambiqueMyanmarNamibiaNepalNetherlandsNew ZealandNicaraguaNigerNigeriaNorth AmericaNorwayOECD membersOmanOther small statesPacific island small statesPakistanPanamaPapua New GuineaParaguayPeruPhilippinesPolandPortugalPost-demographic dividendPre-demographic dividendQatarRomaniaRussian FederationRwandaSamoaSao Tome and PrincipeSaudi ArabiaSenegalSeychellesSierra LeoneSingaporeSlovak RepublicSloveniaSmall statesSolomon IslandsSouth AfricaSouth AsiaSouth Asia (IDA & IBRD)SpainSri LankaSt. LuciaSt. Vincent and the GrenadinesSub-Saharan Africa Sub-Saharan Africa (excluding high income)Sub-Saharan Africa (IDA & IBRD countries)SudanSurinameSwazilandSwedenSwitzerlandSyrian Arab RepublicTajikistanTanzaniaThailandTogoTongaTrinidad and TobagoTunisiaTurkeyTurkmenistanUgandaUkraineUnited Arab EmiratesUnited KingdomUnited StatesUpper middle incomeUruguayUzbekistanVanuatuVenezuela, RBVietnamWorldYemen, Rep.ZambiaZimbabwe Timeline:
This timeline shows a graph from 1971 to 2015 of Tunisia. No data until 1970. Number of actual observations by date: 45.
Source name:
World Development Indicators
Source organization:
World Bank staff estimates based on sources and methods in World Bank's "The Changing Wealth of Nations: Measuring Sustainable Development in the New Millennium" (2011).
Categories, topics:
Economy & Growth
Last updated:
apr 23, 2017
Indicators value changes by year
Minimum:
1.267 bln
jan 1, 1971
Maximum:
37.28 bln
jan 1, 2015
At the date of observation
Value
Absolute change
Change from previous value
jan 1, 1971
1.267 bln
+1.267 bln
0.0%
jan 1, 1972
1.496 bln
+229.466 mln
18.12%
jan 1, 1973
1.998 bln
+501.394 mln
33.51%
jan 1, 1974
2.388 bln
+389.955 mln
19.52%
jan 1, 1975
2.966 bln
+578.678 mln
24.24%
jan 1, 1976
3.657 bln
+691.273 mln
23.3%
jan 1, 1977
3.787 bln
+129.224 mln
3.53%
jan 1, 1978
4.28 bln
+492.978 mln
13.02%
jan 1, 1979
4.993 bln
+713.696 mln
16.68%
jan 1, 1980
5.661 bln
+667.431 mln
13.37%
jan 1, 1981
6.883 bln
+1.223 bln
21.6%
jan 1, 1982
6.652 bln
-231.203 mln
-3.36%
jan 1, 1983
6.446 bln
-206.484 mln
-3.1%
jan 1, 1984
6.674 bln
+228.265 mln
3.54%
jan 1, 1985
6.536 bln
-137.713 mln
-2.06%
jan 1, 1986
6.6 bln
+63.832 mln
0.98%
jan 1, 1987
7.253 bln
+652.453 mln
9.89%
jan 1, 1988
7.75 bln
+497.263 mln
6.86%
jan 1, 1989
8.227 bln
+477.037 mln
6.16%
jan 1, 1990
8.235 bln
+7.985 mln
0.1%
jan 1, 1991
10.268 bln
+2.033 bln
24.69%
jan 1, 1992
10.61 bln
+342.087 mln
3.33%
jan 1, 1993
11.625 bln
+1.014 bln
9.56%
jan 1, 1994
10.807 bln
-817.468 mln
-7.03%
jan 1, 1995
11.735 bln
+927.65 mln
8.58%
jan 1, 1996
13.751 bln
+2.016 bln
17.18%
jan 1, 1997
14.82 bln
+1.069 bln
7.77%
jan 1, 1998
15.981 bln
+1.162 bln
7.84%
jan 1, 1999
17.01 bln
+1.029 bln
6.44%
jan 1, 2000
17.931 bln
+920.96 mln
5.41%
jan 1, 2001
16.498 bln
-1.433 bln
-7.99%
jan 1, 2002
17.332 bln
+834.484 mln
5.06%
jan 1, 2003
18.114 bln
+782.175 mln
4.51%
jan 1, 2004
21.663 bln
+3.549 bln
19.59%
jan 1, 2005
24.51 bln
+2.847 bln
13.14%
jan 1, 2006
24.633 bln
+123.271 mln
0.5%
jan 1, 2007
26.341 bln
+1.707 bln
6.93%
jan 1, 2008
28.904 bln
+2.563 bln
9.73%
jan 1, 2009
31.402 bln
+2.498 bln
8.64%
jan 1, 2010
33.022 bln
+1.62 bln
5.16%
jan 1, 2011
32.876 bln
-146.455 mln
-0.44%
jan 1, 2012
34.057 bln
+1.181 bln
3.59%
jan 1, 2013
33.697 bln
-359.337 mln
-1.06%
jan 1, 2014
35.186 bln
+1.489 bln
4.42%
jan 1, 2015
37.28 bln
+2.093 bln
5.95%
Ranking of countries by current statistics by years


Comments: