29
/
en
AIzaSyAYiBZKx7MnpbEhh9jyipgxe19OcubqV5w
April 1, 2024
254816
Swaziland
SWZ
true
2
1
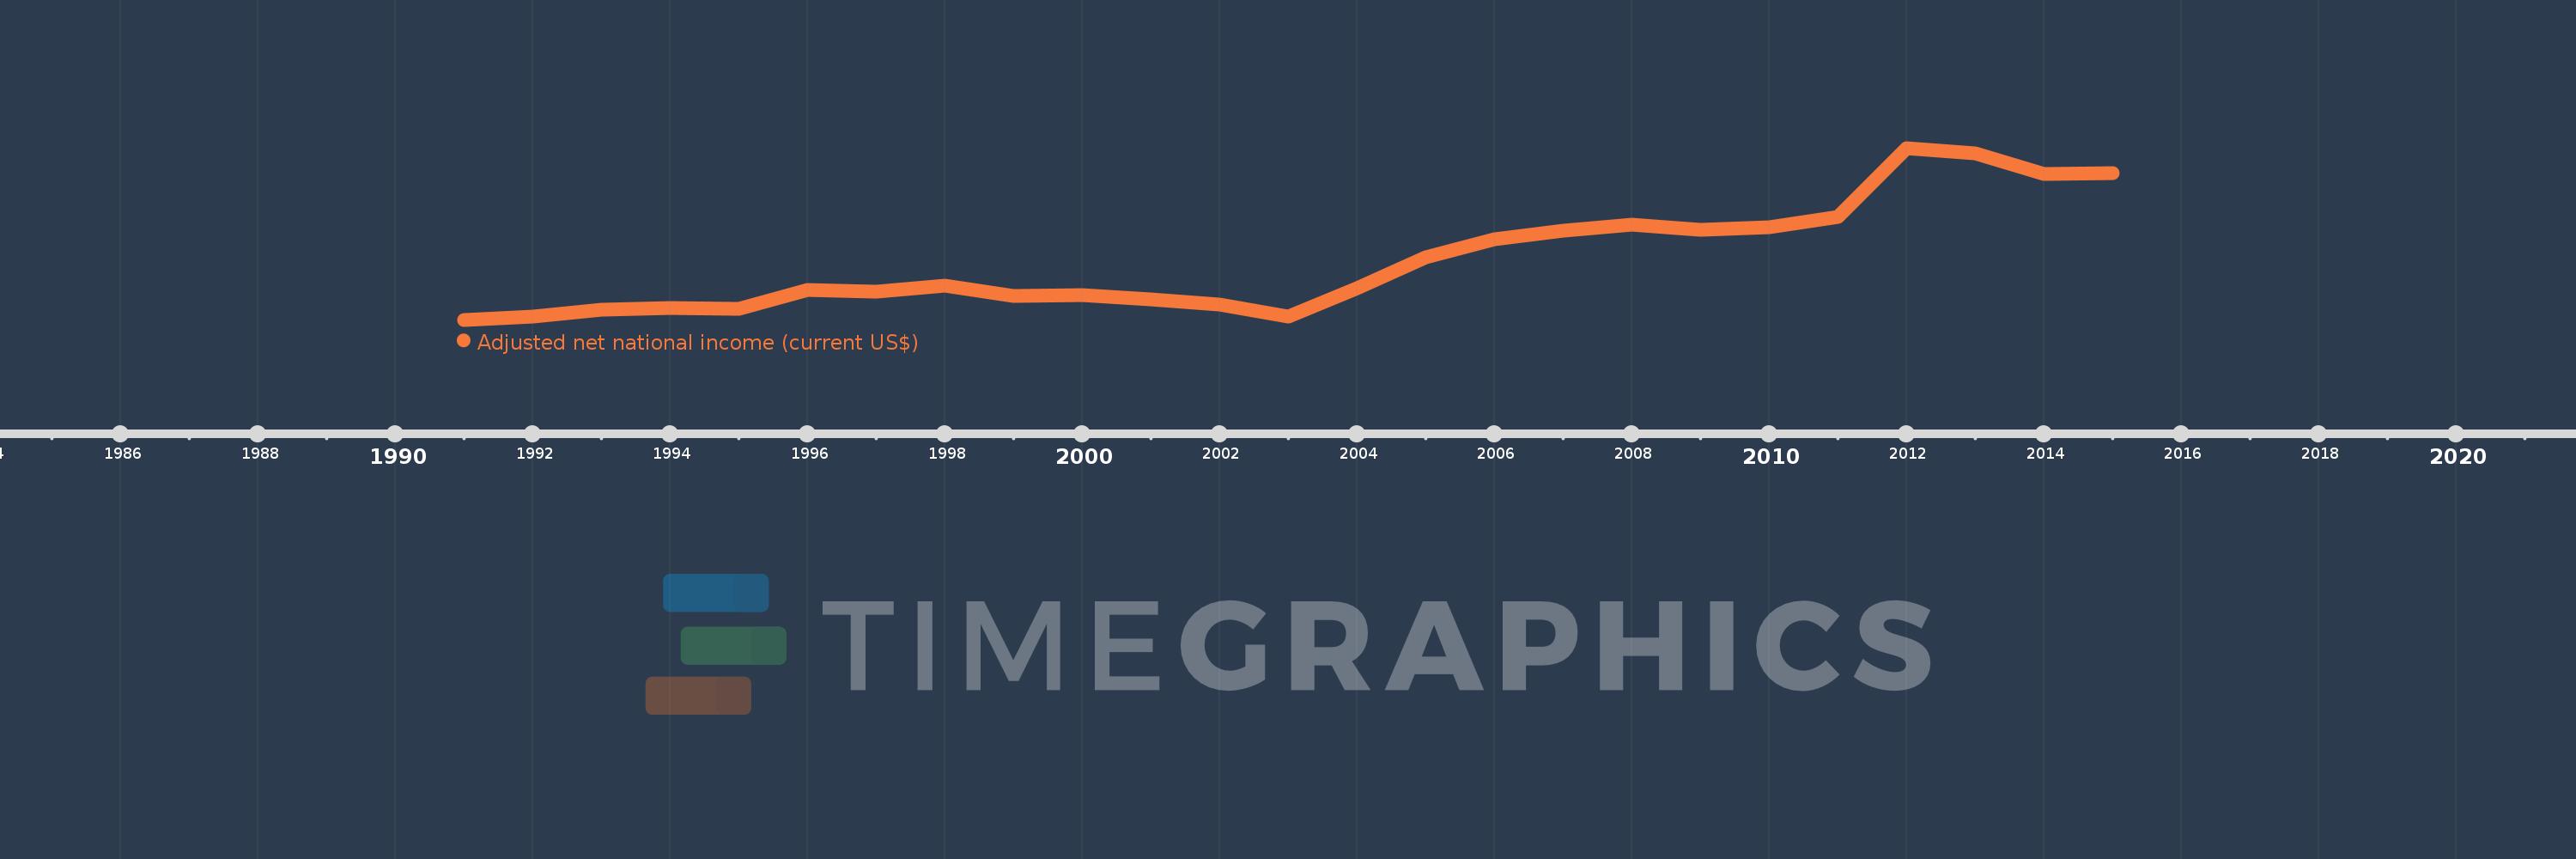
Adjusted net national income (current US$)
2015,2014,2013,2012,2011,2010,2009,2008,2007,2006,2005,2004,2003,2002,2001,2000,1999,1998,1997,1996,1995,1994,1993,1992,1991
This statistics in other country:
AfghanistanAlbaniaAlgeriaAngolaArab WorldArgentinaArmeniaAustraliaAustriaAzerbaijanBahamas, TheBahrainBangladeshBarbadosBelarusBelgiumBelizeBeninBhutanBoliviaBotswanaBrazilBrunei DarussalamBulgariaBurkina FasoBurundiCabo VerdeCambodiaCameroonCanadaCaribbean small statesCentral African RepublicCentral Europe and the BalticsChadChileChinaColombiaComorosCongo, Dem. Rep.Congo, Rep.Costa RicaCote d'IvoireCroatiaCubaCyprusCzech RepublicDenmarkDjiboutiDominicaDominican RepublicEarly-demographic dividendEast Asia & PacificEast Asia & Pacific (excluding high income)East Asia & Pacific (IDA & IBRD countries)EcuadorEgypt, Arab Rep.El SalvadorEquatorial GuineaEritreaEstoniaEthiopiaEuro areaEurope & Central AsiaEurope & Central Asia (excluding high income)Europe & Central Asia (IDA & IBRD countries)European UnionFijiFinlandFragile and conflict affected situationsFranceGabonGambia, TheGeorgiaGermanyGhanaGreeceGuatemalaGuineaGuinea-BissauGuyanaHaitiHeavily indebted poor countries (HIPC)High incomeHondurasHong Kong SAR, ChinaHungaryIBRD onlyIcelandIDA & IBRD totalIDA blendIDA onlyIDA totalIndiaIndonesiaIran, Islamic Rep.IraqIrelandIsraelItalyJamaicaJapanJordanKazakhstanKenyaKiribatiKorea, Rep.KuwaitKyrgyz RepublicLao PDRLate-demographic dividendLatin America & Caribbean Latin America & Caribbean (excluding high income)Latin America & the Caribbean (IDA & IBRD countries)LatviaLeast developed countries: UN classificationLebanonLesothoLiberiaLibyaLithuaniaLow & middle incomeLow incomeLower middle incomeLuxembourgMacedonia, FYRMadagascarMalawiMalaysiaMaldivesMaliMauritaniaMauritiusMexicoMiddle East & North AfricaMiddle East & North Africa (excluding high income)Middle East & North Africa (IDA & IBRD countries)Middle incomeMoldovaMongoliaMoroccoMozambiqueMyanmarNamibiaNepalNetherlandsNew ZealandNicaraguaNigerNigeriaNorth AmericaNorwayOECD membersOmanOther small statesPacific island small statesPakistanPanamaPapua New GuineaParaguayPeruPhilippinesPolandPortugalPost-demographic dividendPre-demographic dividendQatarRomaniaRussian FederationRwandaSamoaSao Tome and PrincipeSaudi ArabiaSenegalSeychellesSierra LeoneSingaporeSlovak RepublicSloveniaSmall statesSolomon IslandsSouth AfricaSouth AsiaSouth Asia (IDA & IBRD)SpainSri LankaSt. LuciaSt. Vincent and the GrenadinesSub-Saharan Africa Sub-Saharan Africa (excluding high income)Sub-Saharan Africa (IDA & IBRD countries)SudanSurinameSwazilandSwedenSwitzerlandSyrian Arab RepublicTajikistanTanzaniaThailandTogoTongaTrinidad and TobagoTunisiaTurkeyTurkmenistanUgandaUkraineUnited Arab EmiratesUnited KingdomUnited StatesUpper middle incomeUruguayUzbekistanVanuatuVenezuela, RBVietnamWorldYemen, Rep.ZambiaZimbabwe Timeline:
This timeline shows a graph from 1991 to 2015 of Swaziland. No data until 1990. Number of actual observations by date: 25.
Source name:
World Development Indicators
Source organization:
World Bank staff estimates based on sources and methods in World Bank's "The Changing Wealth of Nations: Measuring Sustainable Development in the New Millennium" (2011).
Categories, topics:
Economy & Growth
Last updated:
apr 23, 2017
Indicators value changes by year
Minimum:
992.907 mln
jan 1, 1991
Maximum:
3.974 bln
jan 1, 2012
At the date of observation
Value
Absolute change
Change from previous value
jan 1, 1991
992.907 mln
+992.907 mln
0.0%
jan 1, 1992
1.044 bln
+51.271 mln
5.16%
jan 1, 1993
1.169 bln
+124.453 mln
11.92%
jan 1, 1994
1.194 bln
+25.529 mln
2.18%
jan 1, 1995
1.186 bln
-8.65 mln
-0.72%
jan 1, 1996
1.514 bln
+328.893 mln
27.74%
jan 1, 1997
1.479 bln
-35.213 mln
-2.33%
jan 1, 1998
1.589 bln
+109.403 mln
7.4%
jan 1, 1999
1.409 bln
-179.941 mln
-11.33%
jan 1, 2000
1.421 bln
+12.003 mln
0.85%
jan 1, 2001
1.345 bln
-75.77 mln
-5.33%
jan 1, 2002
1.257 bln
-87.8 mln
-6.53%
jan 1, 2003
1.044 bln
-213.234 mln
-16.96%
jan 1, 2004
1.541 bln
+497.05 mln
47.62%
jan 1, 2005
2.076 bln
+534.802 mln
34.71%
jan 1, 2006
2.395 bln
+319.527 mln
15.39%
jan 1, 2007
2.546 bln
+150.438 mln
6.28%
jan 1, 2008
2.648 bln
+102.631 mln
4.03%
jan 1, 2009
2.556 bln
-92.277 mln
-3.48%
jan 1, 2010
2.604 bln
+47.795 mln
1.87%
jan 1, 2011
2.773 bln
+169.583 mln
6.51%
jan 1, 2012
3.974 bln
+1.2 bln
43.28%
jan 1, 2013
3.881 bln
-92.92 mln
-2.34%
jan 1, 2014
3.527 bln
-354.155 mln
-9.13%
jan 1, 2015
3.537 bln
+10.074 mln
0.29%
Ranking of countries by current statistics by years


Comments: