29
/
en
AIzaSyAYiBZKx7MnpbEhh9jyipgxe19OcubqV5w
April 1, 2024
125734
El Salvador
SLV
true
2
1
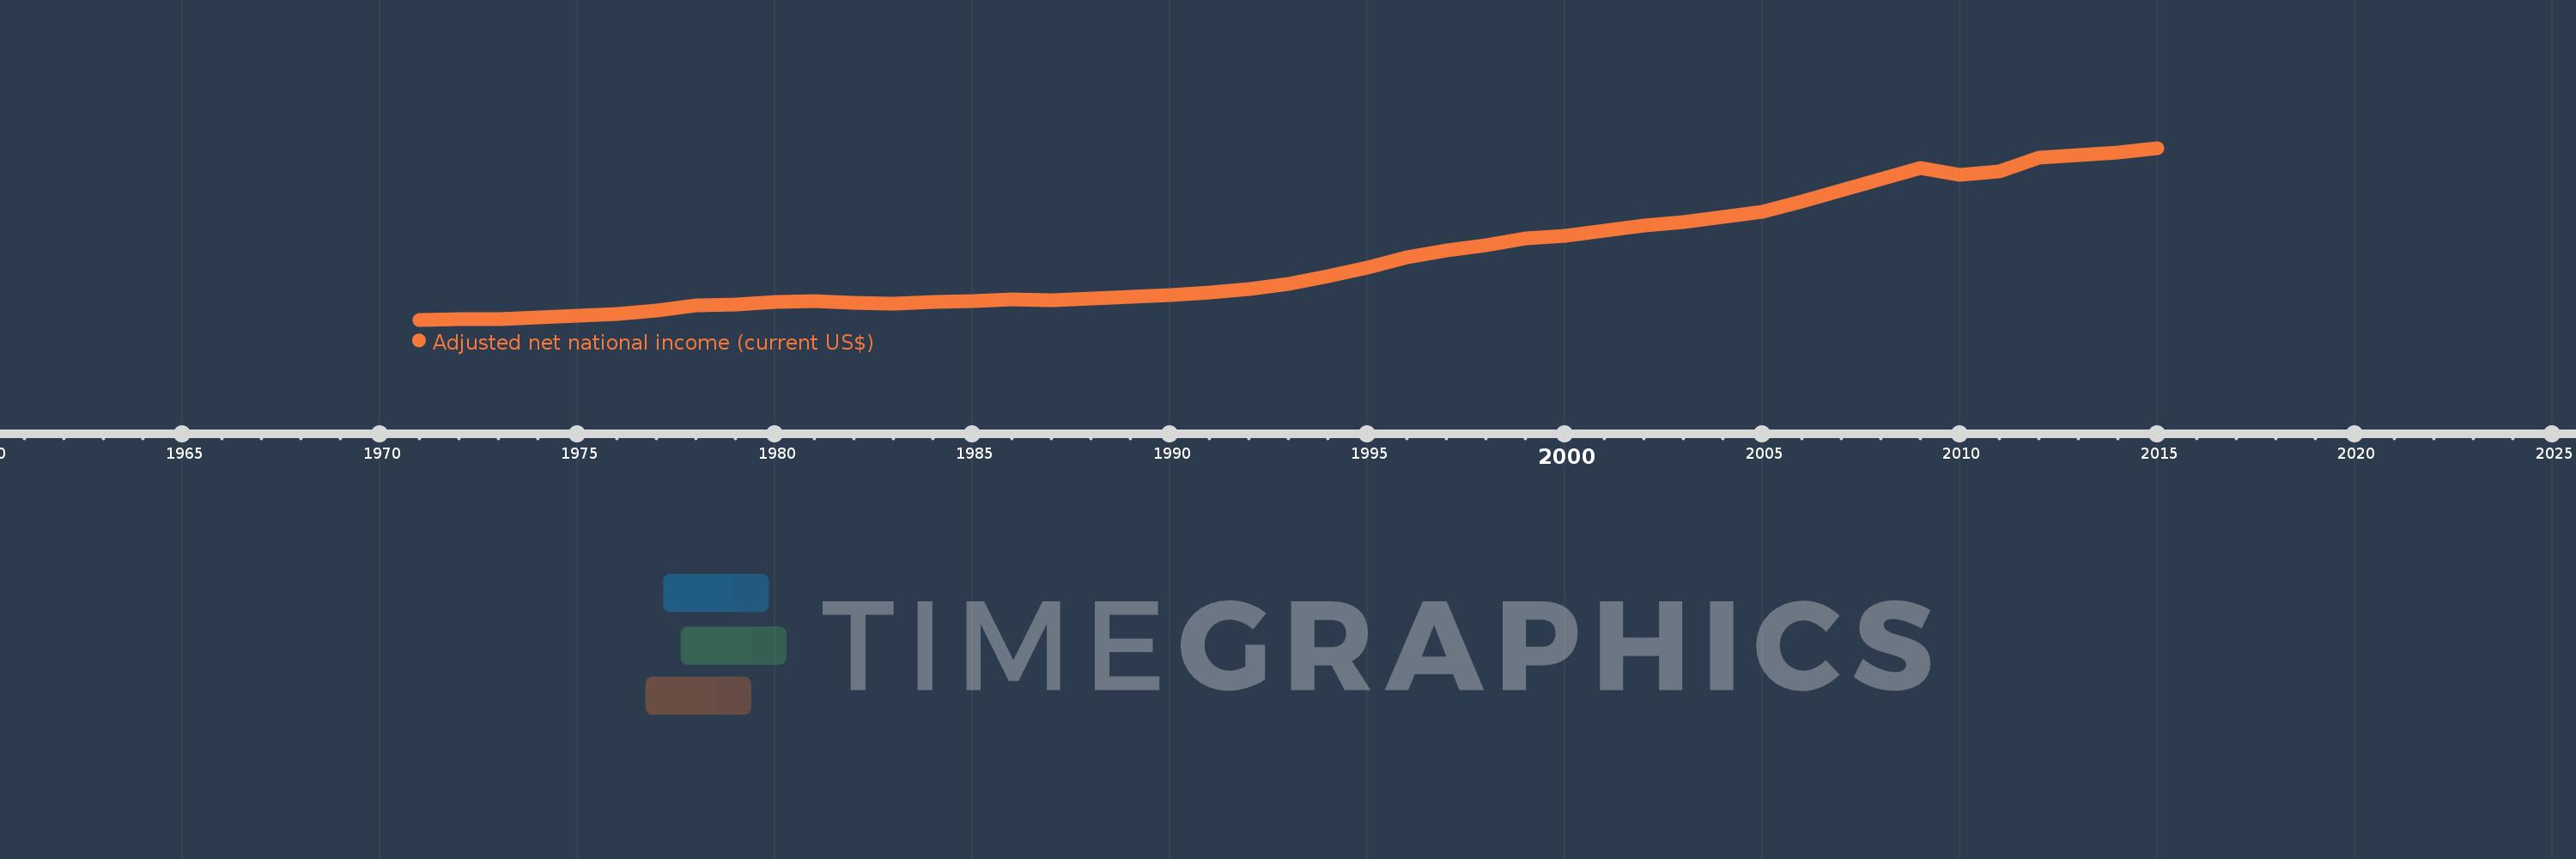
Adjusted net national income (current US$)
2015,2014,2013,2012,2011,2010,2009,2008,2007,2006,2005,2004,2003,2002,2001,2000,1999,1998,1997,1996,1995,1994,1993,1992,1991,1990,1989,1988,1987,1986,1985,1984,1983,1982,1981,1980,1979,1978,1977,1976,1975,1974,1973,1972,1971
This statistics in other country:
AfghanistanAlbaniaAlgeriaAngolaArab WorldArgentinaArmeniaAustraliaAustriaAzerbaijanBahamas, TheBahrainBangladeshBarbadosBelarusBelgiumBelizeBeninBhutanBoliviaBotswanaBrazilBrunei DarussalamBulgariaBurkina FasoBurundiCabo VerdeCambodiaCameroonCanadaCaribbean small statesCentral African RepublicCentral Europe and the BalticsChadChileChinaColombiaComorosCongo, Dem. Rep.Congo, Rep.Costa RicaCote d'IvoireCroatiaCubaCyprusCzech RepublicDenmarkDjiboutiDominicaDominican RepublicEarly-demographic dividendEast Asia & PacificEast Asia & Pacific (excluding high income)East Asia & Pacific (IDA & IBRD countries)EcuadorEgypt, Arab Rep.El SalvadorEquatorial GuineaEritreaEstoniaEthiopiaEuro areaEurope & Central AsiaEurope & Central Asia (excluding high income)Europe & Central Asia (IDA & IBRD countries)European UnionFijiFinlandFragile and conflict affected situationsFranceGabonGambia, TheGeorgiaGermanyGhanaGreeceGuatemalaGuineaGuinea-BissauGuyanaHaitiHeavily indebted poor countries (HIPC)High incomeHondurasHong Kong SAR, ChinaHungaryIBRD onlyIcelandIDA & IBRD totalIDA blendIDA onlyIDA totalIndiaIndonesiaIran, Islamic Rep.IraqIrelandIsraelItalyJamaicaJapanJordanKazakhstanKenyaKiribatiKorea, Rep.KuwaitKyrgyz RepublicLao PDRLate-demographic dividendLatin America & Caribbean Latin America & Caribbean (excluding high income)Latin America & the Caribbean (IDA & IBRD countries)LatviaLeast developed countries: UN classificationLebanonLesothoLiberiaLibyaLithuaniaLow & middle incomeLow incomeLower middle incomeLuxembourgMacedonia, FYRMadagascarMalawiMalaysiaMaldivesMaliMauritaniaMauritiusMexicoMiddle East & North AfricaMiddle East & North Africa (excluding high income)Middle East & North Africa (IDA & IBRD countries)Middle incomeMoldovaMongoliaMoroccoMozambiqueMyanmarNamibiaNepalNetherlandsNew ZealandNicaraguaNigerNigeriaNorth AmericaNorwayOECD membersOmanOther small statesPacific island small statesPakistanPanamaPapua New GuineaParaguayPeruPhilippinesPolandPortugalPost-demographic dividendPre-demographic dividendQatarRomaniaRussian FederationRwandaSamoaSao Tome and PrincipeSaudi ArabiaSenegalSeychellesSierra LeoneSingaporeSlovak RepublicSloveniaSmall statesSolomon IslandsSouth AfricaSouth AsiaSouth Asia (IDA & IBRD)SpainSri LankaSt. LuciaSt. Vincent and the GrenadinesSub-Saharan Africa Sub-Saharan Africa (excluding high income)Sub-Saharan Africa (IDA & IBRD countries)SudanSurinameSwazilandSwedenSwitzerlandSyrian Arab RepublicTajikistanTanzaniaThailandTogoTongaTrinidad and TobagoTunisiaTurkeyTurkmenistanUgandaUkraineUnited Arab EmiratesUnited KingdomUnited StatesUpper middle incomeUruguayUzbekistanVanuatuVenezuela, RBVietnamWorldYemen, Rep.ZambiaZimbabwe Timeline:
This timeline shows a graph from 1971 to 2015 of El Salvador. No data until 1970. Number of actual observations by date: 45.
Source name:
World Development Indicators
Source organization:
World Bank staff estimates based on sources and methods in World Bank's "The Changing Wealth of Nations: Measuring Sustainable Development in the New Millennium" (2011).
Categories, topics:
Economy & Growth
Last updated:
apr 23, 2017
Indicators value changes by year
Minimum:
1.052 bln
jan 1, 1971
Maximum:
21.374 bln
jan 1, 2015
At the date of observation
Value
Absolute change
Change from previous value
jan 1, 1971
1.052 bln
+1.052 bln
0.0%
jan 1, 1972
1.103 bln
+50.661 mln
4.81%
jan 1, 1973
1.171 bln
+67.862 mln
6.15%
jan 1, 1974
1.328 bln
+157.48 mln
13.45%
jan 1, 1975
1.519 bln
+190.897 mln
14.37%
jan 1, 1976
1.7 bln
+180.525 mln
11.88%
jan 1, 1977
2.16 bln
+460.329 mln
27.08%
jan 1, 1978
2.708 bln
+547.904 mln
25.36%
jan 1, 1979
2.853 bln
+144.874 mln
5.35%
jan 1, 1980
3.182 bln
+328.612 mln
11.52%
jan 1, 1981
3.208 bln
+26.902 mln
0.85%
jan 1, 1982
3.07 bln
-138.517 mln
-4.32%
jan 1, 1983
2.924 bln
-145.631 mln
-4.74%
jan 1, 1984
3.125 bln
+200.863 mln
6.87%
jan 1, 1985
3.292 bln
+166.297 mln
5.32%
jan 1, 1986
3.426 bln
+134.934 mln
4.1%
jan 1, 1987
3.405 bln
-21.808 mln
-0.64%
jan 1, 1988
3.559 bln
+154.829 mln
4.55%
jan 1, 1989
3.779 bln
+219.84 mln
6.18%
jan 1, 1990
3.946 bln
+166.375 mln
4.4%
jan 1, 1991
4.226 bln
+280.733 mln
7.11%
jan 1, 1992
4.644 bln
+417.947 mln
9.89%
jan 1, 1993
5.269 bln
+624.374 mln
13.44%
jan 1, 1994
6.188 bln
+919.394 mln
17.45%
jan 1, 1995
7.249 bln
+1.061 bln
17.14%
jan 1, 1996
8.455 bln
+1.206 bln
16.64%
jan 1, 1997
9.236 bln
+780.861 mln
9.24%
jan 1, 1998
9.847 bln
+610.558 mln
6.61%
jan 1, 1999
10.669 bln
+822.086 mln
8.35%
jan 1, 2000
10.974 bln
+305.7 mln
2.87%
jan 1, 2001
11.615 bln
+640.407 mln
5.84%
jan 1, 2002
12.205 bln
+590.352 mln
5.08%
jan 1, 2003
12.593 bln
+387.757 mln
3.18%
jan 1, 2004
13.17 bln
+576.616 mln
4.58%
jan 1, 2005
13.823 bln
+652.99 mln
4.96%
jan 1, 2006
15.0 bln
+1.177 bln
8.52%
jan 1, 2007
16.327 bln
+1.327 bln
8.85%
jan 1, 2008
17.715 bln
+1.388 bln
8.5%
jan 1, 2009
18.987 bln
+1.272 bln
7.18%
jan 1, 2010
18.182 bln
-805.258 mln
-4.24%
jan 1, 2011
18.598 bln
+416.001 mln
2.29%
jan 1, 2012
20.18 bln
+1.582 bln
8.51%
jan 1, 2013
20.556 bln
+375.501 mln
1.86%
jan 1, 2014
20.859 bln
+303.256 mln
1.48%
jan 1, 2015
21.374 bln
+514.925 mln
2.47%
Ranking of countries by current statistics by years


Comments: