29
/
en
AIzaSyAYiBZKx7MnpbEhh9jyipgxe19OcubqV5w
April 1, 2024
147585
Guyana
GUY
true
2
1
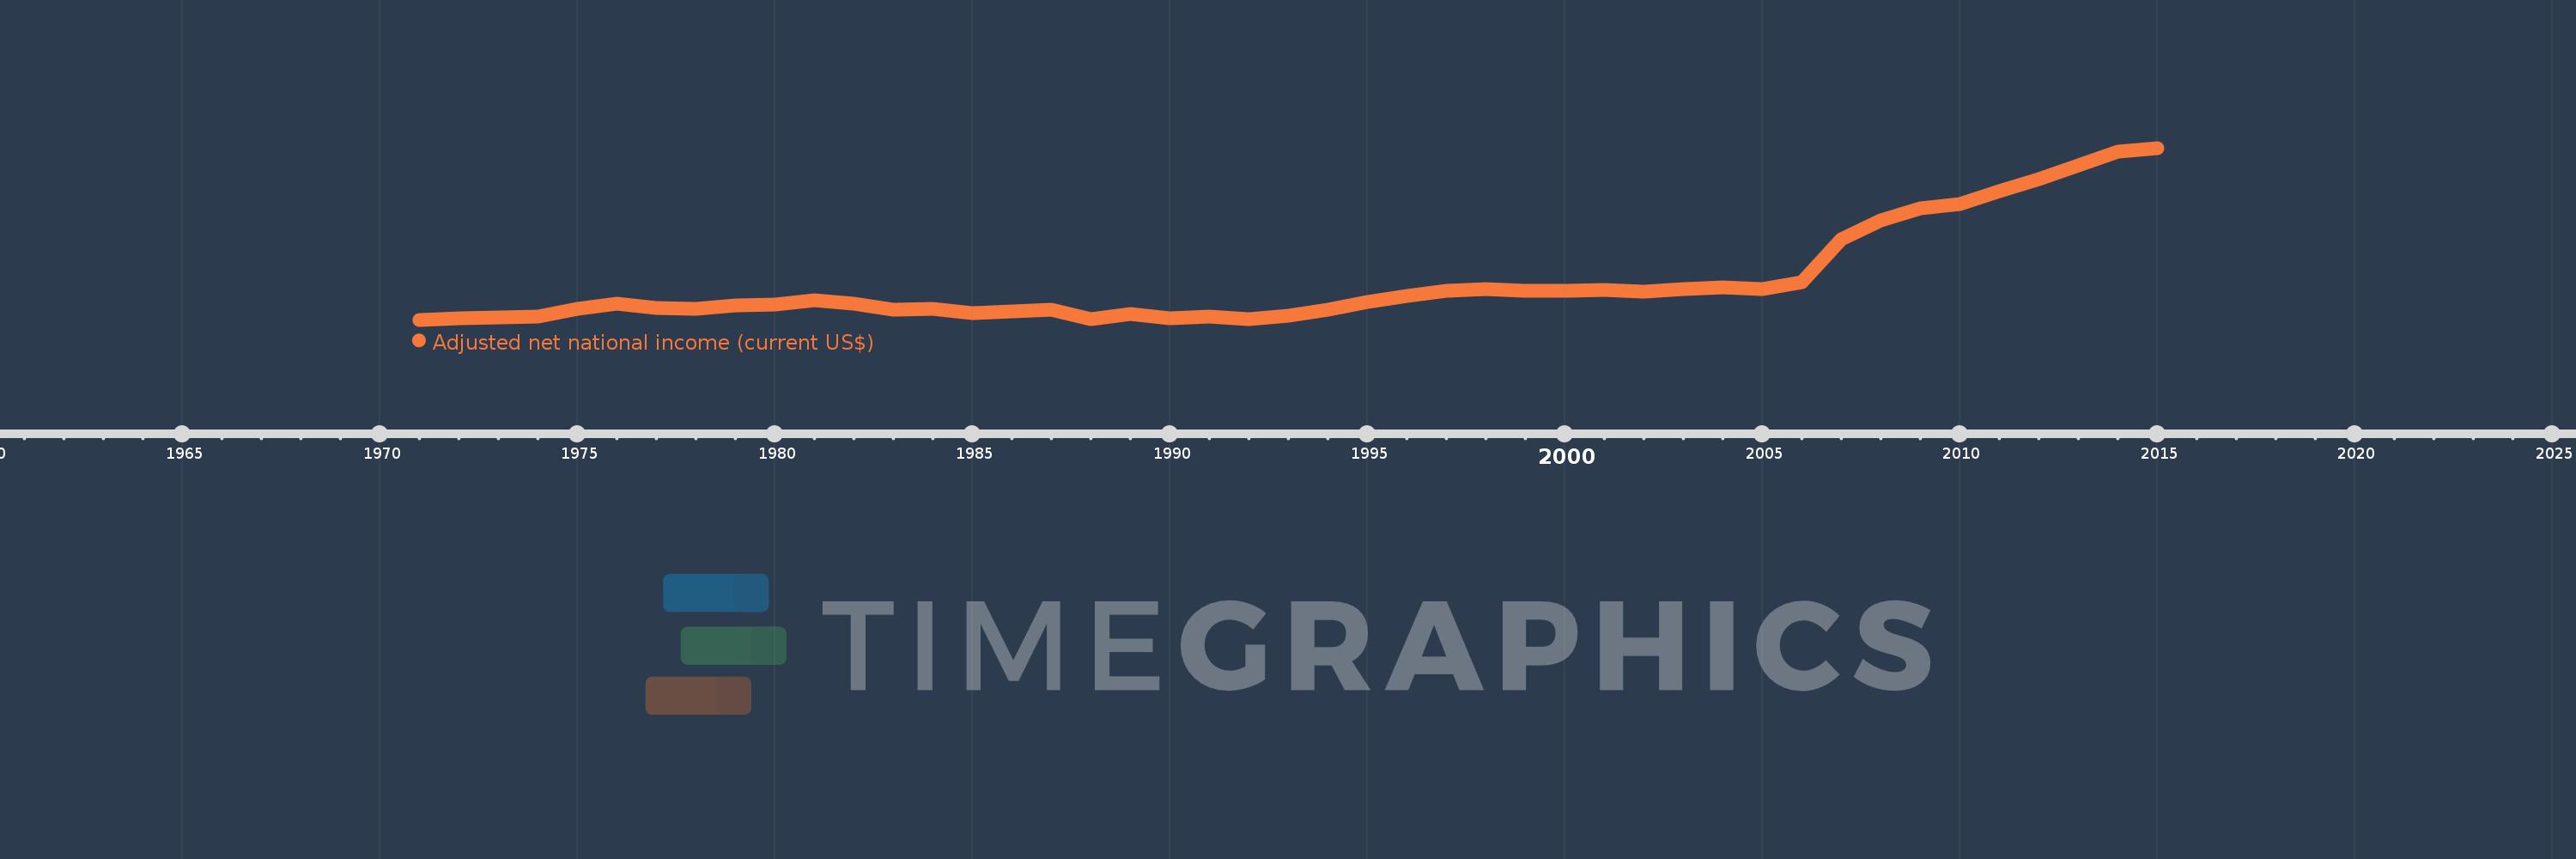
Adjusted net national income (current US$)
2015,2014,2013,2012,2011,2010,2009,2008,2007,2006,2005,2004,2003,2002,2001,2000,1999,1998,1997,1996,1995,1994,1993,1992,1991,1990,1989,1988,1987,1986,1985,1984,1983,1982,1981,1980,1979,1978,1977,1976,1975,1974,1973,1972,1971
This statistics in other country:
AfghanistanAlbaniaAlgeriaAngolaArab WorldArgentinaArmeniaAustraliaAustriaAzerbaijanBahamas, TheBahrainBangladeshBarbadosBelarusBelgiumBelizeBeninBhutanBoliviaBotswanaBrazilBrunei DarussalamBulgariaBurkina FasoBurundiCabo VerdeCambodiaCameroonCanadaCaribbean small statesCentral African RepublicCentral Europe and the BalticsChadChileChinaColombiaComorosCongo, Dem. Rep.Congo, Rep.Costa RicaCote d'IvoireCroatiaCubaCyprusCzech RepublicDenmarkDjiboutiDominicaDominican RepublicEarly-demographic dividendEast Asia & PacificEast Asia & Pacific (excluding high income)East Asia & Pacific (IDA & IBRD countries)EcuadorEgypt, Arab Rep.El SalvadorEquatorial GuineaEritreaEstoniaEthiopiaEuro areaEurope & Central AsiaEurope & Central Asia (excluding high income)Europe & Central Asia (IDA & IBRD countries)European UnionFijiFinlandFragile and conflict affected situationsFranceGabonGambia, TheGeorgiaGermanyGhanaGreeceGuatemalaGuineaGuinea-BissauGuyanaHaitiHeavily indebted poor countries (HIPC)High incomeHondurasHong Kong SAR, ChinaHungaryIBRD onlyIcelandIDA & IBRD totalIDA blendIDA onlyIDA totalIndiaIndonesiaIran, Islamic Rep.IraqIrelandIsraelItalyJamaicaJapanJordanKazakhstanKenyaKiribatiKorea, Rep.KuwaitKyrgyz RepublicLao PDRLate-demographic dividendLatin America & Caribbean Latin America & Caribbean (excluding high income)Latin America & the Caribbean (IDA & IBRD countries)LatviaLeast developed countries: UN classificationLebanonLesothoLiberiaLibyaLithuaniaLow & middle incomeLow incomeLower middle incomeLuxembourgMacedonia, FYRMadagascarMalawiMalaysiaMaldivesMaliMauritaniaMauritiusMexicoMiddle East & North AfricaMiddle East & North Africa (excluding high income)Middle East & North Africa (IDA & IBRD countries)Middle incomeMoldovaMongoliaMoroccoMozambiqueMyanmarNamibiaNepalNetherlandsNew ZealandNicaraguaNigerNigeriaNorth AmericaNorwayOECD membersOmanOther small statesPacific island small statesPakistanPanamaPapua New GuineaParaguayPeruPhilippinesPolandPortugalPost-demographic dividendPre-demographic dividendQatarRomaniaRussian FederationRwandaSamoaSao Tome and PrincipeSaudi ArabiaSenegalSeychellesSierra LeoneSingaporeSlovak RepublicSloveniaSmall statesSolomon IslandsSouth AfricaSouth AsiaSouth Asia (IDA & IBRD)SpainSri LankaSt. LuciaSt. Vincent and the GrenadinesSub-Saharan Africa Sub-Saharan Africa (excluding high income)Sub-Saharan Africa (IDA & IBRD countries)SudanSurinameSwazilandSwedenSwitzerlandSyrian Arab RepublicTajikistanTanzaniaThailandTogoTongaTrinidad and TobagoTunisiaTurkeyTurkmenistanUgandaUkraineUnited Arab EmiratesUnited KingdomUnited StatesUpper middle incomeUruguayUzbekistanVanuatuVenezuela, RBVietnamWorldYemen, Rep.ZambiaZimbabwe Timeline:
This timeline shows a graph from 1971 to 2015 of Guyana. No data until 1970. Number of actual observations by date: 45.
Source name:
World Development Indicators
Source organization:
World Bank staff estimates based on sources and methods in World Bank's "The Changing Wealth of Nations: Measuring Sustainable Development in the New Millennium" (2011).
Categories, topics:
Economy & Growth
Last updated:
apr 23, 2017
Indicators value changes by year
Minimum:
211.643 mln
jan 1, 1971
Maximum:
2.616 bln
jan 1, 2015
At the date of observation
Value
Absolute change
Change from previous value
jan 1, 1971
211.643 mln
+211.643 mln
0.0%
jan 1, 1972
230.373 mln
+18.73 mln
8.85%
jan 1, 1973
244.645 mln
+14.272 mln
6.2%
jan 1, 1974
260.826 mln
+16.18 mln
6.61%
jan 1, 1975
363.501 mln
+102.675 mln
39.37%
jan 1, 1976
432.561 mln
+69.061 mln
19.0%
jan 1, 1977
380.532 mln
-52.029 mln
-12.03%
jan 1, 1978
362.197 mln
-18.335 mln
-4.82%
jan 1, 1979
414.824 mln
+52.627 mln
14.53%
jan 1, 1980
430.402 mln
+15.578 mln
3.76%
jan 1, 1981
487.673 mln
+57.271 mln
13.31%
jan 1, 1982
440.393 mln
-47.28 mln
-9.69%
jan 1, 1983
354.711 mln
-85.682 mln
-19.46%
jan 1, 1984
364.555 mln
+9.844 mln
2.78%
jan 1, 1985
299.085 mln
-65.47 mln
-17.96%
jan 1, 1986
327.656 mln
+28.571 mln
9.55%
jan 1, 1987
356.623 mln
+28.967 mln
8.84%
jan 1, 1988
221.5 mln
-135.123 mln
-37.89%
jan 1, 1989
288.086 mln
+66.586 mln
30.06%
jan 1, 1990
233.658 mln
-54.428 mln
-18.89%
jan 1, 1991
253.267 mln
+19.609 mln
8.39%
jan 1, 1992
219.843 mln
-33.424 mln
-13.2%
jan 1, 1993
267.325 mln
+47.482 mln
21.6%
jan 1, 1994
350.417 mln
+83.092 mln
31.08%
jan 1, 1995
456.547 mln
+106.13 mln
30.29%
jan 1, 1996
547.918 mln
+91.371 mln
20.01%
jan 1, 1997
622.641 mln
+74.723 mln
13.64%
jan 1, 1998
644.571 mln
+21.93 mln
3.52%
jan 1, 1999
620.127 mln
-24.444 mln
-3.79%
jan 1, 2000
612.644 mln
-7.483 mln
-1.21%
jan 1, 2001
632.072 mln
+19.429 mln
3.17%
jan 1, 2002
610.41 mln
-21.662 mln
-3.43%
jan 1, 2003
643.96 mln
+33.55 mln
5.5%
jan 1, 2004
664.811 mln
+20.851 mln
3.24%
jan 1, 2005
640.856 mln
-23.955 mln
-3.6%
jan 1, 2006
737.232 mln
+96.376 mln
15.04%
jan 1, 2007
1.343 bln
+606.009 mln
82.2%
jan 1, 2008
1.604 bln
+260.59 mln
19.4%
jan 1, 2009
1.77 bln
+165.889 mln
10.34%
jan 1, 2010
1.828 bln
+58.088 mln
3.28%
jan 1, 2011
2.015 bln
+187.676 mln
10.27%
jan 1, 2012
2.178 bln
+162.047 mln
8.04%
jan 1, 2013
2.374 bln
+195.97 mln
9.0%
jan 1, 2014
2.562 bln
+188.068 mln
7.92%
jan 1, 2015
2.616 bln
+54.165 mln
2.11%
Ranking of countries by current statistics by years


Comments: