29
/
en
AIzaSyAYiBZKx7MnpbEhh9jyipgxe19OcubqV5w
April 1, 2024
171389
Kuwait
KWT
true
2
1
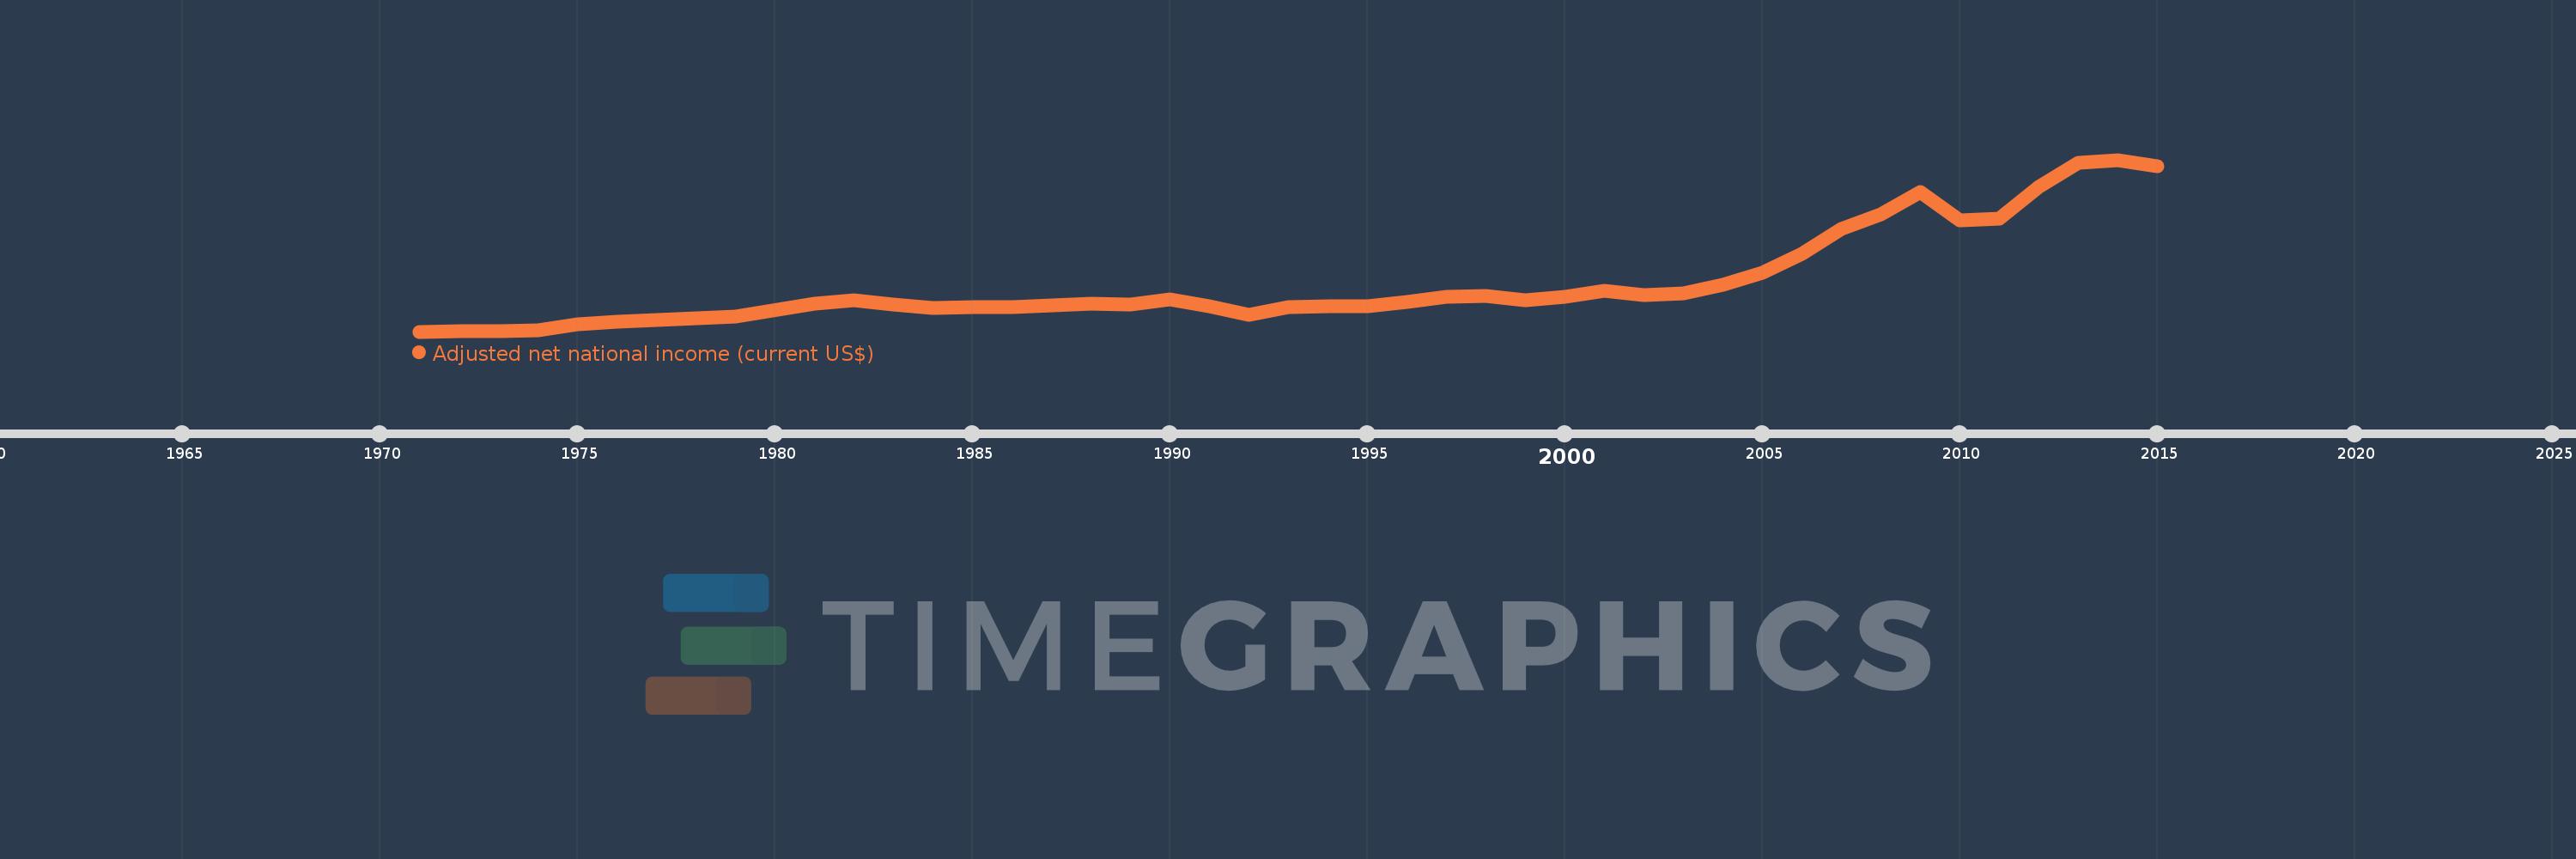
Adjusted net national income (current US$)
2015,2014,2013,2012,2011,2010,2009,2008,2007,2006,2005,2004,2003,2002,2001,2000,1999,1998,1997,1996,1995,1994,1993,1992,1991,1990,1989,1988,1987,1986,1985,1984,1983,1982,1981,1979,1978,1977,1976,1975,1974,1973,1972,1971
This statistics in other country:
AfghanistanAlbaniaAlgeriaAngolaArab WorldArgentinaArmeniaAustraliaAustriaAzerbaijanBahamas, TheBahrainBangladeshBarbadosBelarusBelgiumBelizeBeninBhutanBoliviaBotswanaBrazilBrunei DarussalamBulgariaBurkina FasoBurundiCabo VerdeCambodiaCameroonCanadaCaribbean small statesCentral African RepublicCentral Europe and the BalticsChadChileChinaColombiaComorosCongo, Dem. Rep.Congo, Rep.Costa RicaCote d'IvoireCroatiaCubaCyprusCzech RepublicDenmarkDjiboutiDominicaDominican RepublicEarly-demographic dividendEast Asia & PacificEast Asia & Pacific (excluding high income)East Asia & Pacific (IDA & IBRD countries)EcuadorEgypt, Arab Rep.El SalvadorEquatorial GuineaEritreaEstoniaEthiopiaEuro areaEurope & Central AsiaEurope & Central Asia (excluding high income)Europe & Central Asia (IDA & IBRD countries)European UnionFijiFinlandFragile and conflict affected situationsFranceGabonGambia, TheGeorgiaGermanyGhanaGreeceGuatemalaGuineaGuinea-BissauGuyanaHaitiHeavily indebted poor countries (HIPC)High incomeHondurasHong Kong SAR, ChinaHungaryIBRD onlyIcelandIDA & IBRD totalIDA blendIDA onlyIDA totalIndiaIndonesiaIran, Islamic Rep.IraqIrelandIsraelItalyJamaicaJapanJordanKazakhstanKenyaKiribatiKorea, Rep.KuwaitKyrgyz RepublicLao PDRLate-demographic dividendLatin America & Caribbean Latin America & Caribbean (excluding high income)Latin America & the Caribbean (IDA & IBRD countries)LatviaLeast developed countries: UN classificationLebanonLesothoLiberiaLibyaLithuaniaLow & middle incomeLow incomeLower middle incomeLuxembourgMacedonia, FYRMadagascarMalawiMalaysiaMaldivesMaliMauritaniaMauritiusMexicoMiddle East & North AfricaMiddle East & North Africa (excluding high income)Middle East & North Africa (IDA & IBRD countries)Middle incomeMoldovaMongoliaMoroccoMozambiqueMyanmarNamibiaNepalNetherlandsNew ZealandNicaraguaNigerNigeriaNorth AmericaNorwayOECD membersOmanOther small statesPacific island small statesPakistanPanamaPapua New GuineaParaguayPeruPhilippinesPolandPortugalPost-demographic dividendPre-demographic dividendQatarRomaniaRussian FederationRwandaSamoaSao Tome and PrincipeSaudi ArabiaSenegalSeychellesSierra LeoneSingaporeSlovak RepublicSloveniaSmall statesSolomon IslandsSouth AfricaSouth AsiaSouth Asia (IDA & IBRD)SpainSri LankaSt. LuciaSt. Vincent and the GrenadinesSub-Saharan Africa Sub-Saharan Africa (excluding high income)Sub-Saharan Africa (IDA & IBRD countries)SudanSurinameSwazilandSwedenSwitzerlandSyrian Arab RepublicTajikistanTanzaniaThailandTogoTongaTrinidad and TobagoTunisiaTurkeyTurkmenistanUgandaUkraineUnited Arab EmiratesUnited KingdomUnited StatesUpper middle incomeUruguayUzbekistanVanuatuVenezuela, RBVietnamWorldYemen, Rep.ZambiaZimbabwe Timeline:
This timeline shows a graph from 1971 to 2015 of Kuwait. No data until 1970. Number of actual observations by date: 44.
Source name:
World Development Indicators
Source organization:
World Bank staff estimates based on sources and methods in World Bank's "The Changing Wealth of Nations: Measuring Sustainable Development in the New Millennium" (2011).
Categories, topics:
Economy & Growth
Last updated:
apr 23, 2017
Indicators value changes by year
Minimum:
1.668 bln
jan 1, 1971
Maximum:
132.456 bln
jan 1, 2014
At the date of observation
Value
Absolute change
Change from previous value
jan 1, 1971
1.668 bln
+1.668 bln
0.0%
jan 1, 1972
2.153 bln
+485.005 mln
29.07%
jan 1, 1973
2.217 bln
+63.211 mln
2.94%
jan 1, 1974
2.67 bln
+453.618 mln
20.46%
jan 1, 1975
7.283 bln
+4.613 bln
172.74%
jan 1, 1976
8.986 bln
+1.703 bln
23.38%
jan 1, 1977
10.284 bln
+1.298 bln
14.45%
jan 1, 1978
11.506 bln
+1.222 bln
11.88%
jan 1, 1979
13.027 bln
+1.522 bln
13.23%
jan 1, 1981
22.677 bln
+9.649 bln
74.07%
jan 1, 1982
25.265 bln
+2.588 bln
11.41%
jan 1, 1983
22.073 bln
-3.192 bln
-12.64%
jan 1, 1984
19.827 bln
-2.246 bln
-10.18%
jan 1, 1985
20.046 bln
+219.146 mln
1.11%
jan 1, 1986
20.079 bln
+33.545 mln
0.17%
jan 1, 1987
21.392 bln
+1.313 bln
6.54%
jan 1, 1988
22.661 bln
+1.268 bln
5.93%
jan 1, 1989
22.549 bln
-111.138 mln
-0.49%
jan 1, 1990
25.908 bln
+3.359 bln
14.9%
jan 1, 1991
20.837 bln
-5.071 bln
-19.57%
jan 1, 1992
14.161 bln
-6.676 bln
-32.04%
jan 1, 1993
20.365 bln
+6.203 bln
43.81%
jan 1, 1994
21.278 bln
+913.521 mln
4.49%
jan 1, 1995
21.257 bln
-21.685 mln
-0.1%
jan 1, 1996
24.522 bln
+3.265 bln
15.36%
jan 1, 1997
28.177 bln
+3.655 bln
14.9%
jan 1, 1998
28.513 bln
+335.97 mln
1.19%
jan 1, 1999
25.532 bln
-2.981 bln
-10.45%
jan 1, 2000
28.44 bln
+2.908 bln
11.39%
jan 1, 2001
32.914 bln
+4.474 bln
15.73%
jan 1, 2002
29.175 bln
-3.739 bln
-11.36%
jan 1, 2003
30.737 bln
+1.562 bln
5.35%
jan 1, 2004
37.16 bln
+6.423 bln
20.9%
jan 1, 2005
46.732 bln
+9.573 bln
25.76%
jan 1, 2006
60.571 bln
+13.839 bln
29.61%
jan 1, 2007
79.657 bln
+19.086 bln
31.51%
jan 1, 2008
91.236 bln
+11.579 bln
14.54%
jan 1, 2009
107.964 bln
+16.728 bln
18.34%
jan 1, 2010
86.108 bln
-21.857 bln
-20.24%
jan 1, 2011
87.892 bln
+1.784 bln
2.07%
jan 1, 2012
111.981 bln
+24.088 bln
27.41%
jan 1, 2013
130.202 bln
+18.222 bln
16.27%
jan 1, 2014
132.456 bln
+2.254 bln
1.73%
jan 1, 2015
127.285 bln
-5.171 bln
-3.9%
Ranking of countries by current statistics by years


Comments: