29
/
en
AIzaSyAYiBZKx7MnpbEhh9jyipgxe19OcubqV5w
April 1, 2024
202489
Mozambique
MOZ
true
2
1
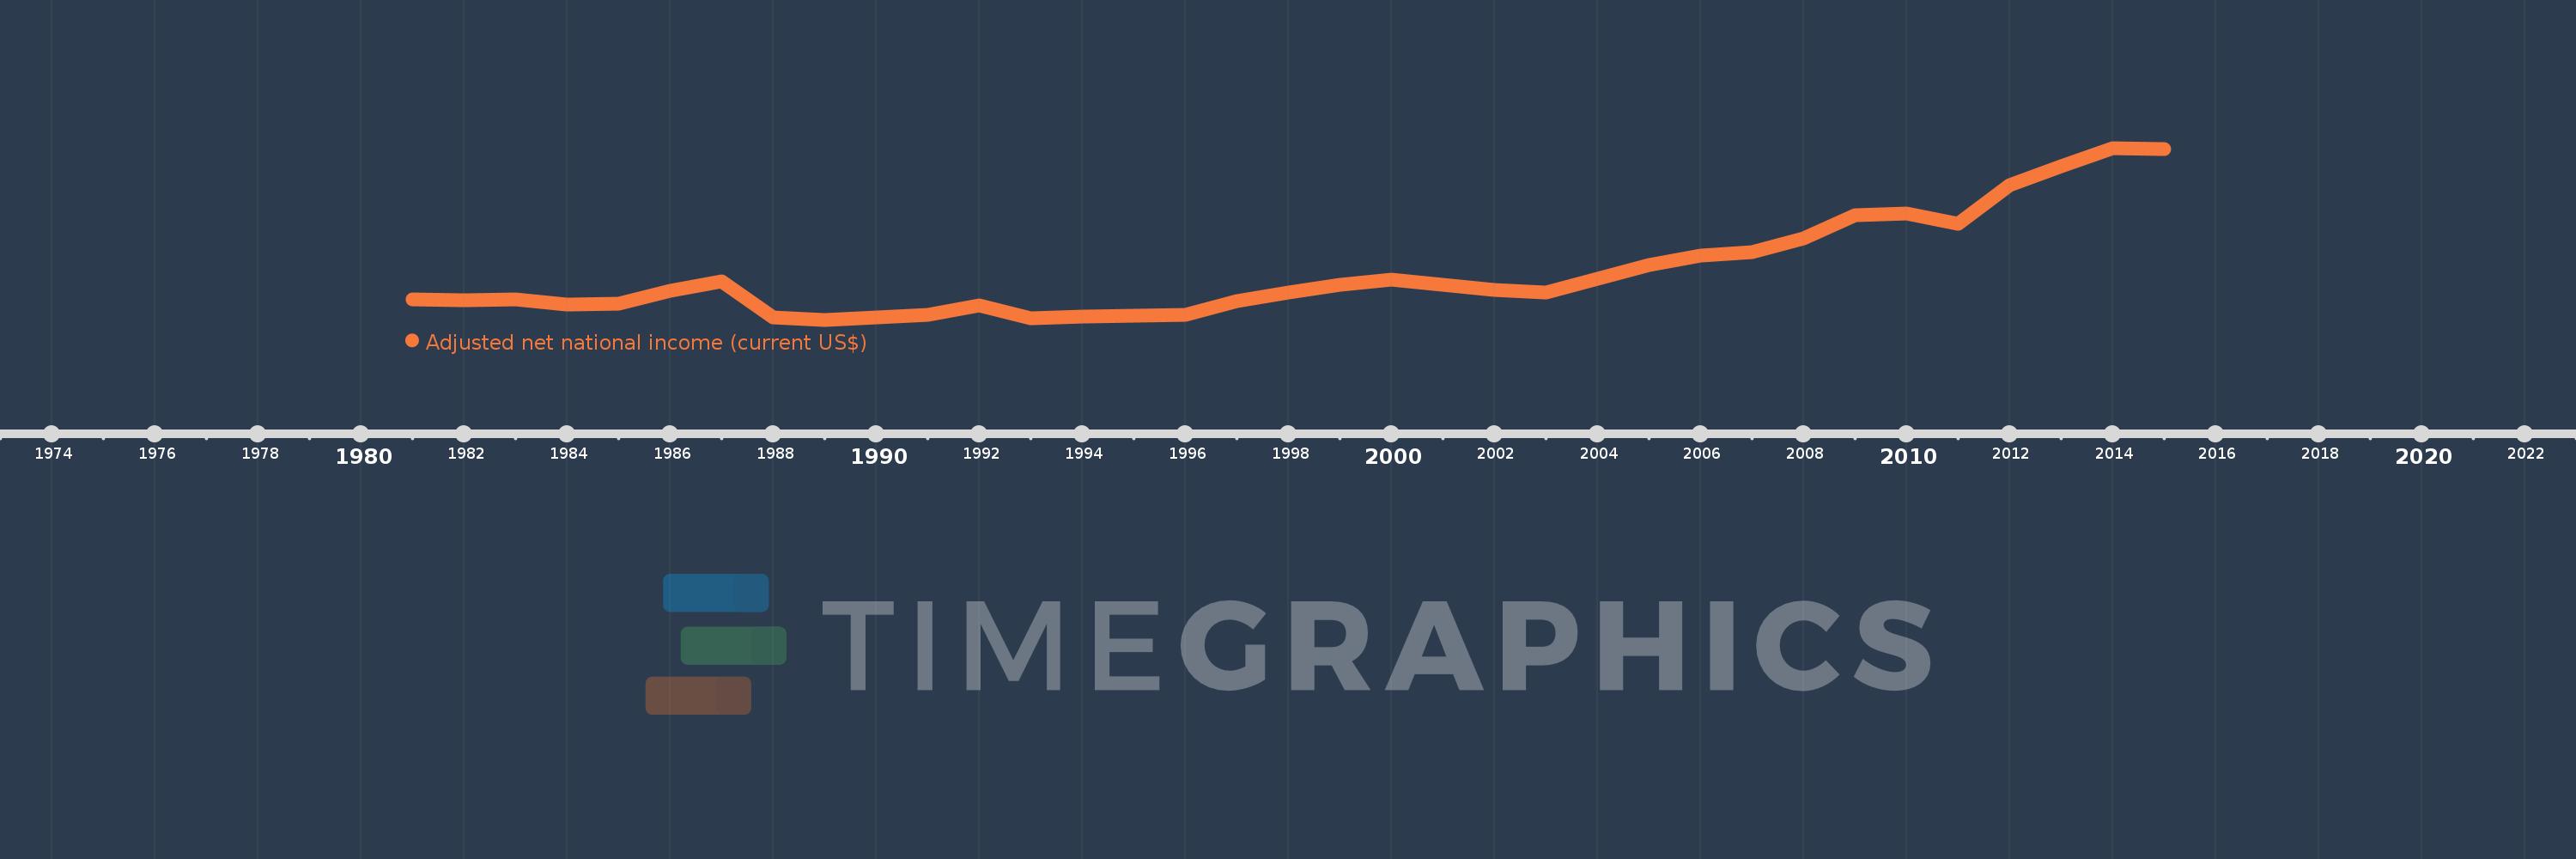
Adjusted net national income (current US$)
2015,2014,2013,2012,2011,2010,2009,2008,2007,2006,2005,2004,2003,2002,2001,2000,1999,1998,1997,1996,1995,1994,1993,1992,1991,1990,1989,1988,1987,1986,1985,1984,1983,1982,1981
This statistics in other country:
AfghanistanAlbaniaAlgeriaAngolaArab WorldArgentinaArmeniaAustraliaAustriaAzerbaijanBahamas, TheBahrainBangladeshBarbadosBelarusBelgiumBelizeBeninBhutanBoliviaBotswanaBrazilBrunei DarussalamBulgariaBurkina FasoBurundiCabo VerdeCambodiaCameroonCanadaCaribbean small statesCentral African RepublicCentral Europe and the BalticsChadChileChinaColombiaComorosCongo, Dem. Rep.Congo, Rep.Costa RicaCote d'IvoireCroatiaCubaCyprusCzech RepublicDenmarkDjiboutiDominicaDominican RepublicEarly-demographic dividendEast Asia & PacificEast Asia & Pacific (excluding high income)East Asia & Pacific (IDA & IBRD countries)EcuadorEgypt, Arab Rep.El SalvadorEquatorial GuineaEritreaEstoniaEthiopiaEuro areaEurope & Central AsiaEurope & Central Asia (excluding high income)Europe & Central Asia (IDA & IBRD countries)European UnionFijiFinlandFragile and conflict affected situationsFranceGabonGambia, TheGeorgiaGermanyGhanaGreeceGuatemalaGuineaGuinea-BissauGuyanaHaitiHeavily indebted poor countries (HIPC)High incomeHondurasHong Kong SAR, ChinaHungaryIBRD onlyIcelandIDA & IBRD totalIDA blendIDA onlyIDA totalIndiaIndonesiaIran, Islamic Rep.IraqIrelandIsraelItalyJamaicaJapanJordanKazakhstanKenyaKiribatiKorea, Rep.KuwaitKyrgyz RepublicLao PDRLate-demographic dividendLatin America & Caribbean Latin America & Caribbean (excluding high income)Latin America & the Caribbean (IDA & IBRD countries)LatviaLeast developed countries: UN classificationLebanonLesothoLiberiaLibyaLithuaniaLow & middle incomeLow incomeLower middle incomeLuxembourgMacedonia, FYRMadagascarMalawiMalaysiaMaldivesMaliMauritaniaMauritiusMexicoMiddle East & North AfricaMiddle East & North Africa (excluding high income)Middle East & North Africa (IDA & IBRD countries)Middle incomeMoldovaMongoliaMoroccoMozambiqueMyanmarNamibiaNepalNetherlandsNew ZealandNicaraguaNigerNigeriaNorth AmericaNorwayOECD membersOmanOther small statesPacific island small statesPakistanPanamaPapua New GuineaParaguayPeruPhilippinesPolandPortugalPost-demographic dividendPre-demographic dividendQatarRomaniaRussian FederationRwandaSamoaSao Tome and PrincipeSaudi ArabiaSenegalSeychellesSierra LeoneSingaporeSlovak RepublicSloveniaSmall statesSolomon IslandsSouth AfricaSouth AsiaSouth Asia (IDA & IBRD)SpainSri LankaSt. LuciaSt. Vincent and the GrenadinesSub-Saharan Africa Sub-Saharan Africa (excluding high income)Sub-Saharan Africa (IDA & IBRD countries)SudanSurinameSwazilandSwedenSwitzerlandSyrian Arab RepublicTajikistanTanzaniaThailandTogoTongaTrinidad and TobagoTunisiaTurkeyTurkmenistanUgandaUkraineUnited Arab EmiratesUnited KingdomUnited StatesUpper middle incomeUruguayUzbekistanVanuatuVenezuela, RBVietnamWorldYemen, Rep.ZambiaZimbabwe Timeline:
This timeline shows a graph from 1981 to 2015 of Mozambique. No data until 1980. Number of actual observations by date: 35.
Source name:
World Development Indicators
Source organization:
World Bank staff estimates based on sources and methods in World Bank's "The Changing Wealth of Nations: Measuring Sustainable Development in the New Millennium" (2011).
Categories, topics:
Economy & Growth
Last updated:
apr 23, 2017
Indicators value changes by year
Minimum:
1.804 bln
jan 1, 1989
Maximum:
13.961 bln
jan 1, 2014
At the date of observation
Value
Absolute change
Change from previous value
jan 1, 1981
3.226 bln
+3.226 bln
0.0%
jan 1, 1982
3.202 bln
-23.481 mln
-0.73%
jan 1, 1983
3.245 bln
+42.662 mln
1.33%
jan 1, 1984
2.852 bln
-393.22 mln
-12.12%
jan 1, 1985
2.962 bln
+110.794 mln
3.89%
jan 1, 1986
3.857 bln
+894.191 mln
30.19%
jan 1, 1987
4.546 bln
+689.718 mln
17.88%
jan 1, 1988
1.993 bln
-2.554 bln
-56.17%
jan 1, 1989
1.804 bln
-188.241 mln
-9.45%
jan 1, 1990
1.956 bln
+151.247 mln
8.38%
jan 1, 1991
2.16 bln
+204.532 mln
10.46%
jan 1, 1992
2.823 bln
+662.963 mln
30.69%
jan 1, 1993
1.909 bln
-914.531 mln
-32.39%
jan 1, 1994
2.017 bln
+108.831 mln
5.7%
jan 1, 1995
2.085 bln
+67.224 mln
3.33%
jan 1, 1996
2.165 bln
+80.102 mln
3.84%
jan 1, 1997
3.106 bln
+941.211 mln
43.48%
jan 1, 1998
3.747 bln
+641.003 mln
20.64%
jan 1, 1999
4.285 bln
+537.697 mln
14.35%
jan 1, 2000
4.658 bln
+373.514 mln
8.72%
jan 1, 2001
4.278 bln
-379.739 mln
-8.15%
jan 1, 2002
3.893 bln
-385.206 mln
-9.0%
jan 1, 2003
3.708 bln
-185.156 mln
-4.76%
jan 1, 2004
4.719 bln
+1.011 bln
27.25%
jan 1, 2005
5.669 bln
+949.983 mln
20.13%
jan 1, 2006
6.374 bln
+705.808 mln
12.45%
jan 1, 2007
6.584 bln
+209.557 mln
3.29%
jan 1, 2008
7.573 bln
+989.345 mln
15.03%
jan 1, 2009
9.227 bln
+1.654 bln
21.84%
jan 1, 2010
9.344 bln
+116.824 mln
1.27%
jan 1, 2011
8.564 bln
-779.819 mln
-8.35%
jan 1, 2012
11.343 bln
+2.779 bln
32.45%
jan 1, 2013
12.665 bln
+1.322 bln
11.65%
jan 1, 2014
13.961 bln
+1.296 bln
10.23%
jan 1, 2015
13.901 bln
-59.637 mln
-0.43%
Ranking of countries by current statistics by years


Comments: