29
/
en
AIzaSyAYiBZKx7MnpbEhh9jyipgxe19OcubqV5w
April 1, 2024
243291
Solomon Islands
SLB
true
2
1
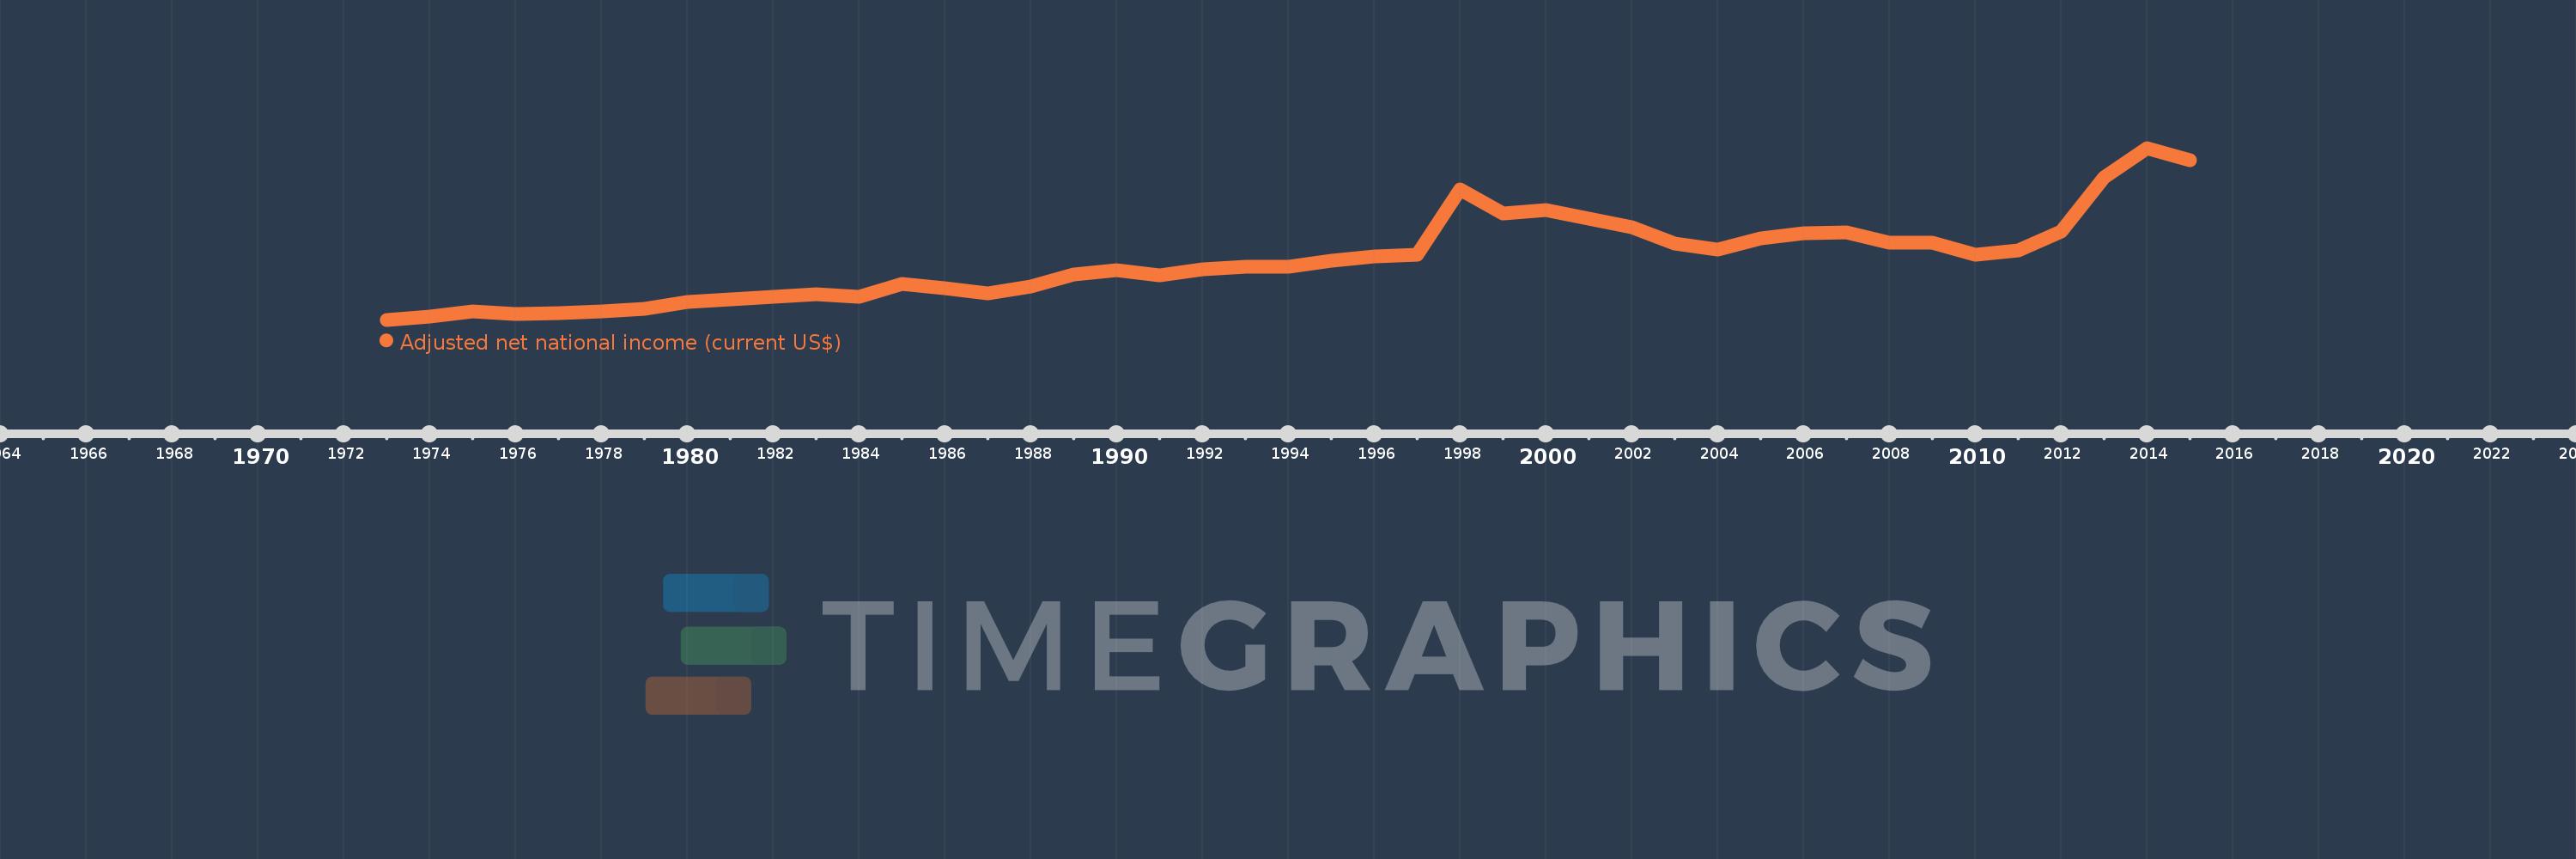
Adjusted net national income (current US$)
2015,2014,2013,2012,2011,2010,2009,2008,2007,2006,2005,2004,2003,2002,2001,2000,1999,1998,1997,1996,1995,1994,1993,1992,1991,1990,1989,1988,1987,1986,1985,1984,1983,1982,1981,1980,1979,1978,1977,1976,1975,1974,1973
This statistics in other country:
AfghanistanAlbaniaAlgeriaAngolaArab WorldArgentinaArmeniaAustraliaAustriaAzerbaijanBahamas, TheBahrainBangladeshBarbadosBelarusBelgiumBelizeBeninBhutanBoliviaBotswanaBrazilBrunei DarussalamBulgariaBurkina FasoBurundiCabo VerdeCambodiaCameroonCanadaCaribbean small statesCentral African RepublicCentral Europe and the BalticsChadChileChinaColombiaComorosCongo, Dem. Rep.Congo, Rep.Costa RicaCote d'IvoireCroatiaCubaCyprusCzech RepublicDenmarkDjiboutiDominicaDominican RepublicEarly-demographic dividendEast Asia & PacificEast Asia & Pacific (excluding high income)East Asia & Pacific (IDA & IBRD countries)EcuadorEgypt, Arab Rep.El SalvadorEquatorial GuineaEritreaEstoniaEthiopiaEuro areaEurope & Central AsiaEurope & Central Asia (excluding high income)Europe & Central Asia (IDA & IBRD countries)European UnionFijiFinlandFragile and conflict affected situationsFranceGabonGambia, TheGeorgiaGermanyGhanaGreeceGuatemalaGuineaGuinea-BissauGuyanaHaitiHeavily indebted poor countries (HIPC)High incomeHondurasHong Kong SAR, ChinaHungaryIBRD onlyIcelandIDA & IBRD totalIDA blendIDA onlyIDA totalIndiaIndonesiaIran, Islamic Rep.IraqIrelandIsraelItalyJamaicaJapanJordanKazakhstanKenyaKiribatiKorea, Rep.KuwaitKyrgyz RepublicLao PDRLate-demographic dividendLatin America & Caribbean Latin America & Caribbean (excluding high income)Latin America & the Caribbean (IDA & IBRD countries)LatviaLeast developed countries: UN classificationLebanonLesothoLiberiaLibyaLithuaniaLow & middle incomeLow incomeLower middle incomeLuxembourgMacedonia, FYRMadagascarMalawiMalaysiaMaldivesMaliMauritaniaMauritiusMexicoMiddle East & North AfricaMiddle East & North Africa (excluding high income)Middle East & North Africa (IDA & IBRD countries)Middle incomeMoldovaMongoliaMoroccoMozambiqueMyanmarNamibiaNepalNetherlandsNew ZealandNicaraguaNigerNigeriaNorth AmericaNorwayOECD membersOmanOther small statesPacific island small statesPakistanPanamaPapua New GuineaParaguayPeruPhilippinesPolandPortugalPost-demographic dividendPre-demographic dividendQatarRomaniaRussian FederationRwandaSamoaSao Tome and PrincipeSaudi ArabiaSenegalSeychellesSierra LeoneSingaporeSlovak RepublicSloveniaSmall statesSolomon IslandsSouth AfricaSouth AsiaSouth Asia (IDA & IBRD)SpainSri LankaSt. LuciaSt. Vincent and the GrenadinesSub-Saharan Africa Sub-Saharan Africa (excluding high income)Sub-Saharan Africa (IDA & IBRD countries)SudanSurinameSwazilandSwedenSwitzerlandSyrian Arab RepublicTajikistanTanzaniaThailandTogoTongaTrinidad and TobagoTunisiaTurkeyTurkmenistanUgandaUkraineUnited Arab EmiratesUnited KingdomUnited StatesUpper middle incomeUruguayUzbekistanVanuatuVenezuela, RBVietnamWorldYemen, Rep.ZambiaZimbabwe Timeline:
This timeline shows a graph from 1973 to 2015 of Solomon Islands. No data until 1972. Number of actual observations by date: 43.
Source name:
World Development Indicators
Source organization:
World Bank staff estimates based on sources and methods in World Bank's "The Changing Wealth of Nations: Measuring Sustainable Development in the New Millennium" (2011).
Categories, topics:
Economy & Growth
Last updated:
apr 23, 2017
Indicators value changes by year
Minimum:
23.468 mln
jan 1, 1973
Maximum:
647.123 mln
jan 1, 2014
At the date of observation
Value
Absolute change
Change from previous value
jan 1, 1973
23.468 mln
+23.468 mln
0.0%
jan 1, 1974
35.138 mln
+11.67 mln
49.73%
jan 1, 1975
52.799 mln
+17.661 mln
50.26%
jan 1, 1976
45.547 mln
-7.252 mln
-13.74%
jan 1, 1977
48.517 mln
+2.97 mln
6.52%
jan 1, 1978
55.043 mln
+6.526 mln
13.45%
jan 1, 1979
62.24 mln
+7.197 mln
13.08%
jan 1, 1980
88.876 mln
+26.636 mln
42.8%
jan 1, 1981
97.11 mln
+8.234 mln
9.26%
jan 1, 1982
108.137 mln
+11.027 mln
11.36%
jan 1, 1983
116.856 mln
+8.719 mln
8.06%
jan 1, 1984
108.257 mln
-8.599 mln
-7.36%
jan 1, 1985
152.848 mln
+44.59 mln
41.19%
jan 1, 1986
137.124 mln
-15.724 mln
-10.29%
jan 1, 1987
120.257 mln
-16.867 mln
-12.3%
jan 1, 1988
144.835 mln
+24.578 mln
20.44%
jan 1, 1989
187.987 mln
+43.151 mln
29.79%
jan 1, 1990
201.945 mln
+13.958 mln
7.43%
jan 1, 1991
184.577 mln
-17.368 mln
-8.6%
jan 1, 1992
206.647 mln
+22.07 mln
11.96%
jan 1, 1993
217.415 mln
+10.768 mln
5.21%
jan 1, 1994
215.979 mln
-1.437 mln
-0.66%
jan 1, 1995
238.542 mln
+22.564 mln
10.45%
jan 1, 1996
254.352 mln
+15.81 mln
6.63%
jan 1, 1997
258.379 mln
+4.027 mln
1.58%
jan 1, 1998
496.752 mln
+238.373 mln
92.26%
jan 1, 1999
410.689 mln
-86.063 mln
-17.33%
jan 1, 2000
421.785 mln
+11.096 mln
2.7%
jan 1, 2001
390.288 mln
-31.498 mln
-7.47%
jan 1, 2002
358.481 mln
-31.806 mln
-8.15%
jan 1, 2003
299.141 mln
-59.34 mln
-16.55%
jan 1, 2004
277.979 mln
-21.162 mln
-7.07%
jan 1, 2005
317.589 mln
+39.61 mln
14.25%
jan 1, 2006
335.965 mln
+18.376 mln
5.79%
jan 1, 2007
342.129 mln
+6.164 mln
1.83%
jan 1, 2008
302.332 mln
-39.797 mln
-11.63%
jan 1, 2009
304.358 mln
+2.026 mln
0.67%
jan 1, 2010
259.676 mln
-44.681 mln
-14.68%
jan 1, 2011
276.34 mln
+16.664 mln
6.42%
jan 1, 2012
344.75 mln
+68.41 mln
24.76%
jan 1, 2013
540.045 mln
+195.295 mln
56.65%
jan 1, 2014
647.123 mln
+107.078 mln
19.83%
jan 1, 2015
603.931 mln
-43.191 mln
-6.67%
Ranking of countries by current statistics by years


Comments: