29
/
en
AIzaSyAYiBZKx7MnpbEhh9jyipgxe19OcubqV5w
April 1, 2024
167048
Kenya
KEN
true
2
1
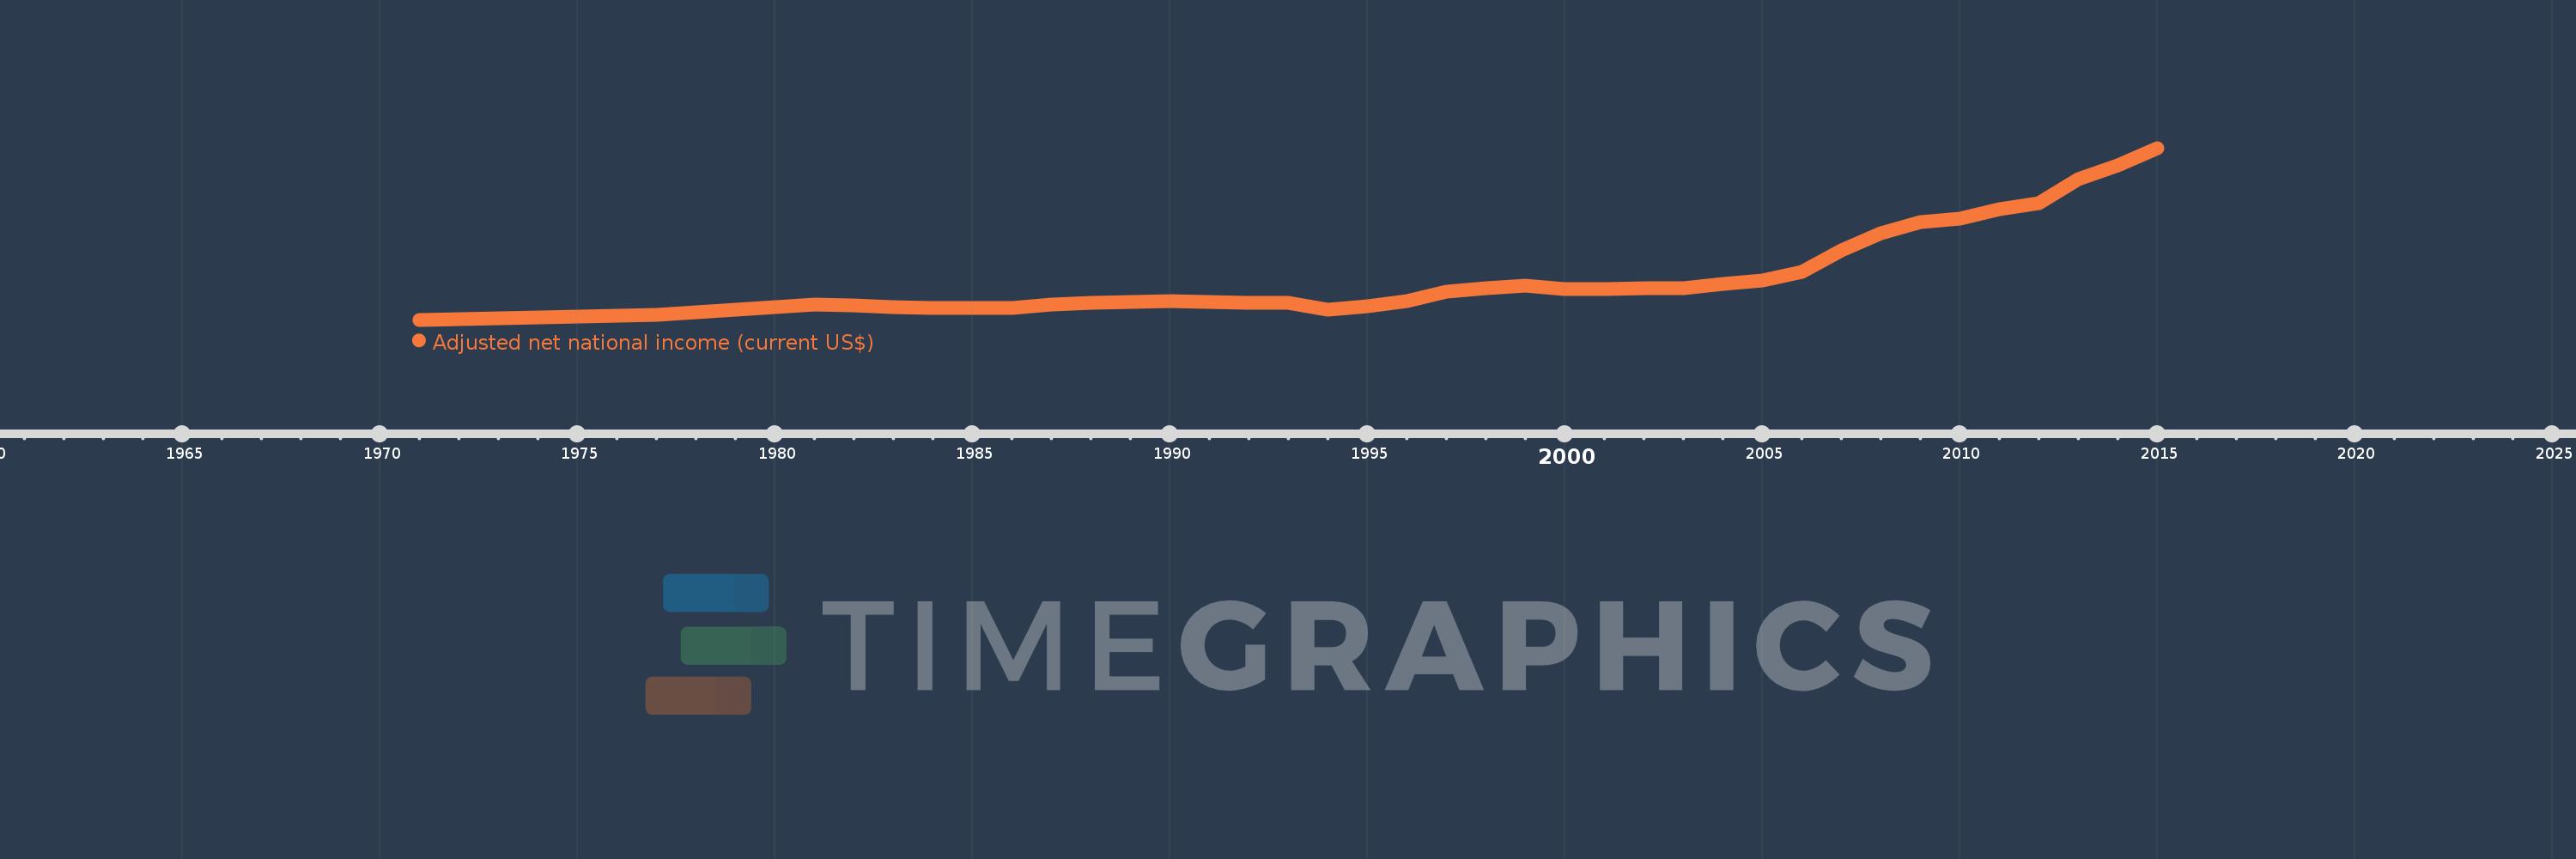
Adjusted net national income (current US$)
2015,2014,2013,2012,2011,2010,2009,2008,2007,2006,2005,2004,2003,2002,2001,2000,1999,1998,1997,1996,1995,1994,1993,1992,1991,1990,1989,1988,1987,1986,1985,1984,1983,1982,1981,1980,1979,1978,1977,1976,1975,1974,1973,1972,1971
This statistics in other country:
AfghanistanAlbaniaAlgeriaAngolaArab WorldArgentinaArmeniaAustraliaAustriaAzerbaijanBahamas, TheBahrainBangladeshBarbadosBelarusBelgiumBelizeBeninBhutanBoliviaBotswanaBrazilBrunei DarussalamBulgariaBurkina FasoBurundiCabo VerdeCambodiaCameroonCanadaCaribbean small statesCentral African RepublicCentral Europe and the BalticsChadChileChinaColombiaComorosCongo, Dem. Rep.Congo, Rep.Costa RicaCote d'IvoireCroatiaCubaCyprusCzech RepublicDenmarkDjiboutiDominicaDominican RepublicEarly-demographic dividendEast Asia & PacificEast Asia & Pacific (excluding high income)East Asia & Pacific (IDA & IBRD countries)EcuadorEgypt, Arab Rep.El SalvadorEquatorial GuineaEritreaEstoniaEthiopiaEuro areaEurope & Central AsiaEurope & Central Asia (excluding high income)Europe & Central Asia (IDA & IBRD countries)European UnionFijiFinlandFragile and conflict affected situationsFranceGabonGambia, TheGeorgiaGermanyGhanaGreeceGuatemalaGuineaGuinea-BissauGuyanaHaitiHeavily indebted poor countries (HIPC)High incomeHondurasHong Kong SAR, ChinaHungaryIBRD onlyIcelandIDA & IBRD totalIDA blendIDA onlyIDA totalIndiaIndonesiaIran, Islamic Rep.IraqIrelandIsraelItalyJamaicaJapanJordanKazakhstanKenyaKiribatiKorea, Rep.KuwaitKyrgyz RepublicLao PDRLate-demographic dividendLatin America & Caribbean Latin America & Caribbean (excluding high income)Latin America & the Caribbean (IDA & IBRD countries)LatviaLeast developed countries: UN classificationLebanonLesothoLiberiaLibyaLithuaniaLow & middle incomeLow incomeLower middle incomeLuxembourgMacedonia, FYRMadagascarMalawiMalaysiaMaldivesMaliMauritaniaMauritiusMexicoMiddle East & North AfricaMiddle East & North Africa (excluding high income)Middle East & North Africa (IDA & IBRD countries)Middle incomeMoldovaMongoliaMoroccoMozambiqueMyanmarNamibiaNepalNetherlandsNew ZealandNicaraguaNigerNigeriaNorth AmericaNorwayOECD membersOmanOther small statesPacific island small statesPakistanPanamaPapua New GuineaParaguayPeruPhilippinesPolandPortugalPost-demographic dividendPre-demographic dividendQatarRomaniaRussian FederationRwandaSamoaSao Tome and PrincipeSaudi ArabiaSenegalSeychellesSierra LeoneSingaporeSlovak RepublicSloveniaSmall statesSolomon IslandsSouth AfricaSouth AsiaSouth Asia (IDA & IBRD)SpainSri LankaSt. LuciaSt. Vincent and the GrenadinesSub-Saharan Africa Sub-Saharan Africa (excluding high income)Sub-Saharan Africa (IDA & IBRD countries)SudanSurinameSwazilandSwedenSwitzerlandSyrian Arab RepublicTajikistanTanzaniaThailandTogoTongaTrinidad and TobagoTunisiaTurkeyTurkmenistanUgandaUkraineUnited Arab EmiratesUnited KingdomUnited StatesUpper middle incomeUruguayUzbekistanVanuatuVenezuela, RBVietnamWorldYemen, Rep.ZambiaZimbabwe Timeline:
This timeline shows a graph from 1971 to 2015 of Kenya. No data until 1970. Number of actual observations by date: 45.
Source name:
World Development Indicators
Source organization:
World Bank staff estimates based on sources and methods in World Bank's "The Changing Wealth of Nations: Measuring Sustainable Development in the New Millennium" (2011).
Categories, topics:
Economy & Growth
Last updated:
apr 23, 2017
Indicators value changes by year
Minimum:
1.396 bln
jan 1, 1971
Maximum:
55.03 bln
jan 1, 2015
At the date of observation
Value
Absolute change
Change from previous value
jan 1, 1971
1.396 bln
+1.396 bln
0.0%
jan 1, 1972
1.556 bln
+160.196 mln
11.48%
jan 1, 1973
1.829 bln
+272.865 mln
17.54%
jan 1, 1974
2.08 bln
+251.384 mln
13.74%
jan 1, 1975
2.497 bln
+416.458 mln
20.02%
jan 1, 1976
2.719 bln
+222.729 mln
8.92%
jan 1, 1977
2.871 bln
+151.158 mln
5.56%
jan 1, 1978
3.747 bln
+876.261 mln
30.52%
jan 1, 1979
4.468 bln
+721.009 mln
19.24%
jan 1, 1980
5.206 bln
+738.027 mln
16.52%
jan 1, 1981
6.081 bln
+874.756 mln
16.8%
jan 1, 1982
5.757 bln
-323.254 mln
-5.32%
jan 1, 1983
5.219 bln
-538.387 mln
-9.35%
jan 1, 1984
4.982 bln
-237.546 mln
-4.55%
jan 1, 1985
5.186 bln
+204.789 mln
4.11%
jan 1, 1986
5.203 bln
+16.206 mln
0.31%
jan 1, 1987
6.122 bln
+919.988 mln
17.68%
jan 1, 1988
6.771 bln
+648.938 mln
10.6%
jan 1, 1989
7.07 bln
+298.108 mln
4.4%
jan 1, 1990
7.101 bln
+31.561 mln
0.45%
jan 1, 1991
7.071 bln
-30.421 mln
-0.43%
jan 1, 1992
6.658 bln
-412.844 mln
-5.84%
jan 1, 1993
6.696 bln
+38.045 mln
0.57%
jan 1, 1994
4.503 bln
-2.193 bln
-32.75%
jan 1, 1995
5.699 bln
+1.196 bln
26.56%
jan 1, 1996
7.268 bln
+1.569 bln
27.52%
jan 1, 1997
10.075 bln
+2.807 bln
38.62%
jan 1, 1998
11.151 bln
+1.076 bln
10.68%
jan 1, 1999
12.063 bln
+911.328 mln
8.17%
jan 1, 2000
11.078 bln
-985.009 mln
-8.17%
jan 1, 2001
10.953 bln
-125.232 mln
-1.13%
jan 1, 2002
11.235 bln
+282.768 mln
2.58%
jan 1, 2003
11.287 bln
+51.329 mln
0.46%
jan 1, 2004
12.537 bln
+1.251 bln
11.08%
jan 1, 2005
13.765 bln
+1.227 bln
9.79%
jan 1, 2006
16.344 bln
+2.579 bln
18.74%
jan 1, 2007
22.956 bln
+6.612 bln
40.46%
jan 1, 2008
28.283 bln
+5.327 bln
23.2%
jan 1, 2009
32.006 bln
+3.723 bln
13.16%
jan 1, 2010
32.996 bln
+990.246 mln
3.09%
jan 1, 2011
35.826 bln
+2.83 bln
8.58%
jan 1, 2012
37.853 bln
+2.027 bln
5.66%
jan 1, 2013
45.414 bln
+7.561 bln
19.98%
jan 1, 2014
49.6 bln
+4.186 bln
9.22%
jan 1, 2015
55.03 bln
+5.429 bln
10.95%
Ranking of countries by current statistics by years


Comments: