29
/
en
AIzaSyAYiBZKx7MnpbEhh9jyipgxe19OcubqV5w
April 1, 2024
29621
Euro area
EMU
false
2
1
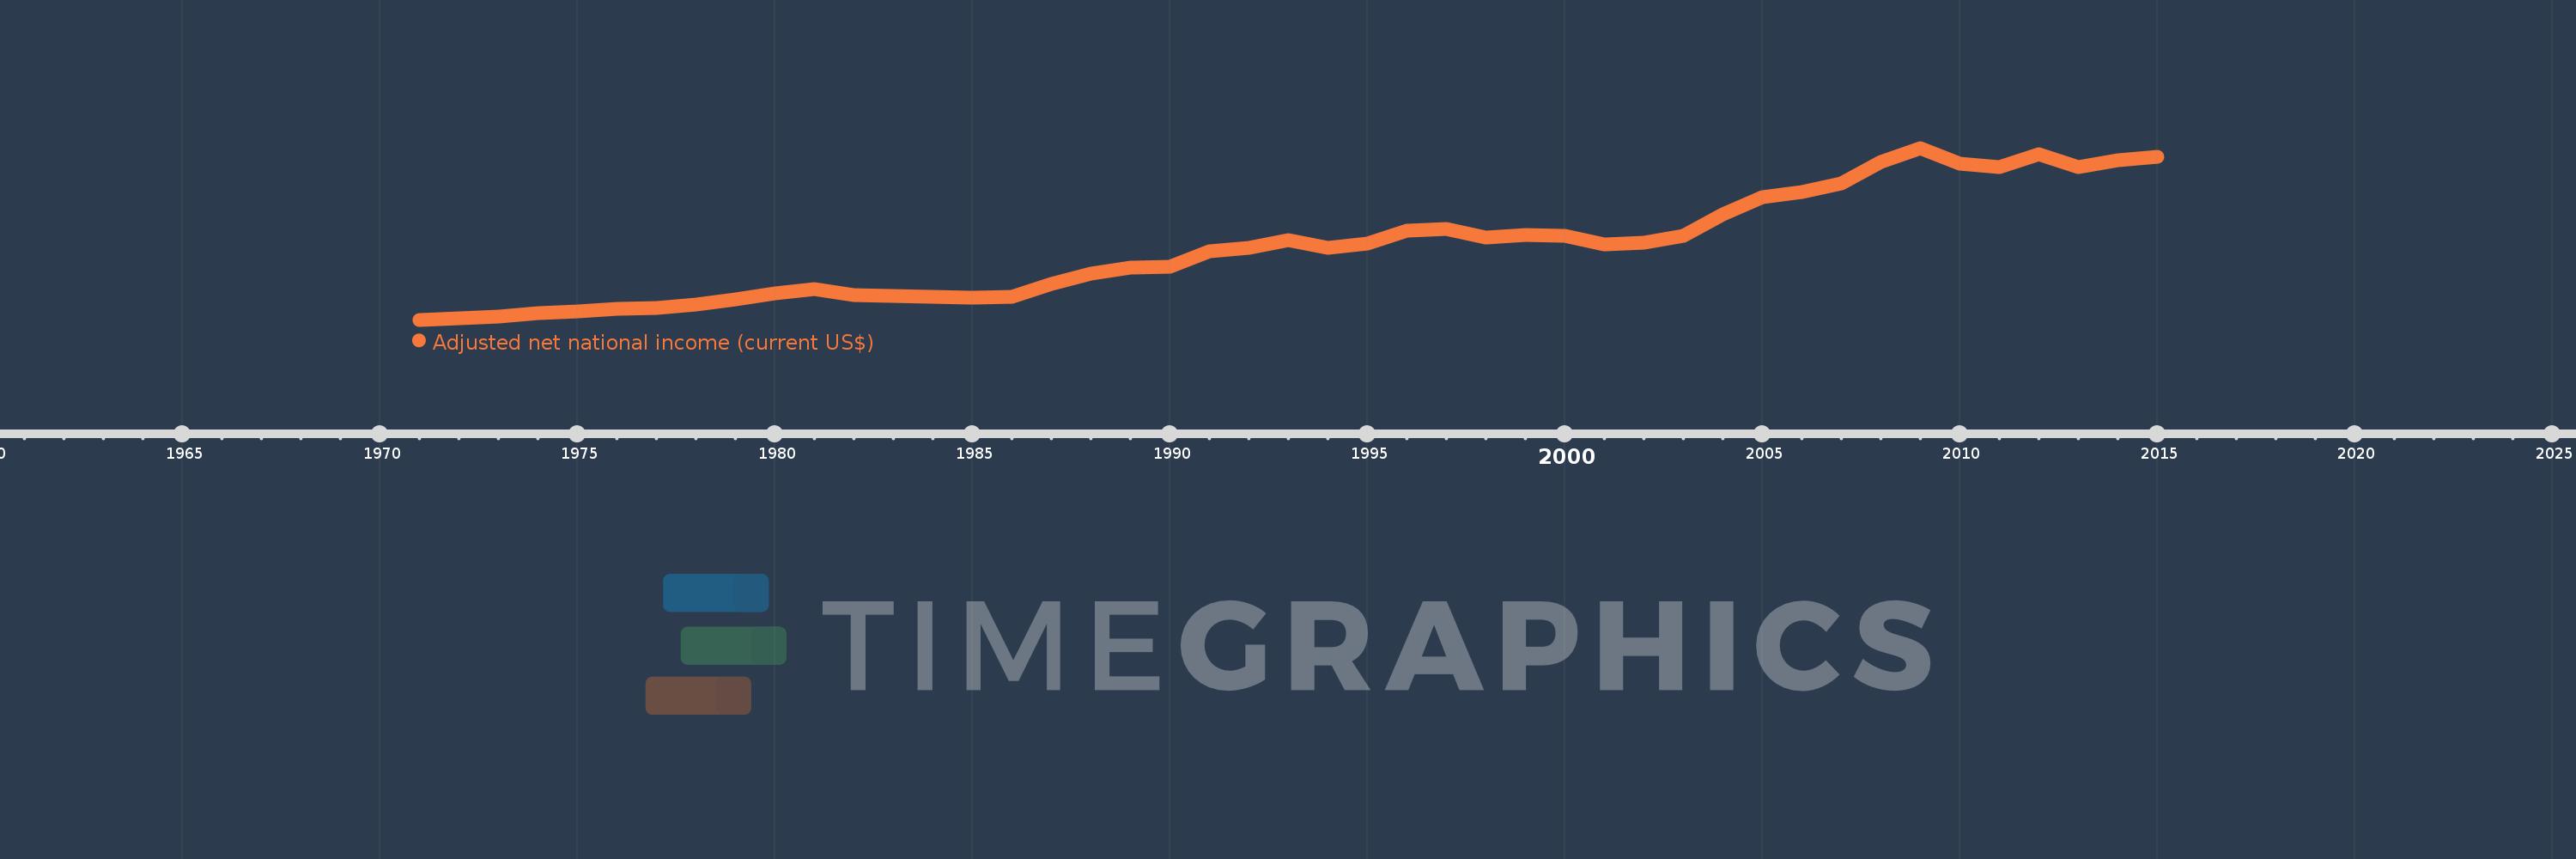
Adjusted net national income (current US$)
2015,2014,2013,2012,2011,2010,2009,2008,2007,2006,2005,2004,2003,2002,2001,2000,1999,1998,1997,1996,1995,1994,1993,1992,1991,1990,1989,1988,1987,1986,1985,1984,1983,1982,1981,1980,1979,1978,1977,1976,1975,1974,1973,1972,1971
This statistics in other country:
AfghanistanAlbaniaAlgeriaAngolaArab WorldArgentinaArmeniaAustraliaAustriaAzerbaijanBahamas, TheBahrainBangladeshBarbadosBelarusBelgiumBelizeBeninBhutanBoliviaBotswanaBrazilBrunei DarussalamBulgariaBurkina FasoBurundiCabo VerdeCambodiaCameroonCanadaCaribbean small statesCentral African RepublicCentral Europe and the BalticsChadChileChinaColombiaComorosCongo, Dem. Rep.Congo, Rep.Costa RicaCote d'IvoireCroatiaCubaCyprusCzech RepublicDenmarkDjiboutiDominicaDominican RepublicEarly-demographic dividendEast Asia & PacificEast Asia & Pacific (excluding high income)East Asia & Pacific (IDA & IBRD countries)EcuadorEgypt, Arab Rep.El SalvadorEquatorial GuineaEritreaEstoniaEthiopiaEuro areaEurope & Central AsiaEurope & Central Asia (excluding high income)Europe & Central Asia (IDA & IBRD countries)European UnionFijiFinlandFragile and conflict affected situationsFranceGabonGambia, TheGeorgiaGermanyGhanaGreeceGuatemalaGuineaGuinea-BissauGuyanaHaitiHeavily indebted poor countries (HIPC)High incomeHondurasHong Kong SAR, ChinaHungaryIBRD onlyIcelandIDA & IBRD totalIDA blendIDA onlyIDA totalIndiaIndonesiaIran, Islamic Rep.IraqIrelandIsraelItalyJamaicaJapanJordanKazakhstanKenyaKiribatiKorea, Rep.KuwaitKyrgyz RepublicLao PDRLate-demographic dividendLatin America & Caribbean Latin America & Caribbean (excluding high income)Latin America & the Caribbean (IDA & IBRD countries)LatviaLeast developed countries: UN classificationLebanonLesothoLiberiaLibyaLithuaniaLow & middle incomeLow incomeLower middle incomeLuxembourgMacedonia, FYRMadagascarMalawiMalaysiaMaldivesMaliMauritaniaMauritiusMexicoMiddle East & North AfricaMiddle East & North Africa (excluding high income)Middle East & North Africa (IDA & IBRD countries)Middle incomeMoldovaMongoliaMoroccoMozambiqueMyanmarNamibiaNepalNetherlandsNew ZealandNicaraguaNigerNigeriaNorth AmericaNorwayOECD membersOmanOther small statesPacific island small statesPakistanPanamaPapua New GuineaParaguayPeruPhilippinesPolandPortugalPost-demographic dividendPre-demographic dividendQatarRomaniaRussian FederationRwandaSamoaSao Tome and PrincipeSaudi ArabiaSenegalSeychellesSierra LeoneSingaporeSlovak RepublicSloveniaSmall statesSolomon IslandsSouth AfricaSouth AsiaSouth Asia (IDA & IBRD)SpainSri LankaSt. LuciaSt. Vincent and the GrenadinesSub-Saharan Africa Sub-Saharan Africa (excluding high income)Sub-Saharan Africa (IDA & IBRD countries)SudanSurinameSwazilandSwedenSwitzerlandSyrian Arab RepublicTajikistanTanzaniaThailandTogoTongaTrinidad and TobagoTunisiaTurkeyTurkmenistanUgandaUkraineUnited Arab EmiratesUnited KingdomUnited StatesUpper middle incomeUruguayUzbekistanVanuatuVenezuela, RBVietnamWorldYemen, Rep.ZambiaZimbabwe Timeline:
This timeline shows a graph from 1971 to 2015 of Euro area. No data until 1970. Number of actual observations by date: 45.
Source name:
World Development Indicators
Source organization:
World Bank staff estimates based on sources and methods in World Bank's "The Changing Wealth of Nations: Measuring Sustainable Development in the New Millennium" (2011).
Categories, topics:
Economy & Growth
Last updated:
apr 23, 2017
Indicators value changes by year
Minimum:
565.495 bln
jan 1, 1971
Maximum:
11.683 trl
jan 1, 2009
At the date of observation
Value
Absolute change
Change from previous value
jan 1, 1971
565.495 bln
+565.495 bln
0.0%
jan 1, 1972
639.297 bln
+73.803 bln
13.05%
jan 1, 1973
769.907 bln
+130.61 bln
20.43%
jan 1, 1974
999.543 bln
+229.636 bln
29.83%
jan 1, 1975
1.119 trl
+119.171 bln
11.92%
jan 1, 1976
1.289 trl
+170.492 bln
15.24%
jan 1, 1977
1.345 trl
+55.636 bln
4.32%
jan 1, 1978
1.525 trl
+180.342 bln
13.41%
jan 1, 1979
1.871 trl
+346.258 bln
22.7%
jan 1, 1980
2.269 trl
+398.035 bln
21.27%
jan 1, 1981
2.526 trl
+256.21 bln
11.29%
jan 1, 1982
2.174 trl
-352.16 bln
-13.94%
jan 1, 1983
2.102 trl
-71.201 bln
-3.28%
jan 1, 1984
2.054 trl
-48.203 bln
-2.29%
jan 1, 1985
1.972 trl
-81.951 bln
-3.99%
jan 1, 1986
2.028 trl
+55.378 bln
2.81%
jan 1, 1987
2.862 trl
+834.562 bln
41.16%
jan 1, 1988
3.546 trl
+683.535 bln
23.88%
jan 1, 1989
3.912 trl
+366.787 bln
10.34%
jan 1, 1990
3.998 trl
+85.568 bln
2.19%
jan 1, 1991
5.021 trl
+1.023 trl
25.58%
jan 1, 1992
5.198 trl
+177.73 bln
3.54%
jan 1, 1993
5.725 trl
+526.422 bln
10.13%
jan 1, 1994
5.208 trl
-516.538 bln
-9.02%
jan 1, 1995
5.481 trl
+272.423 bln
5.23%
jan 1, 1996
6.335 trl
+854.011 bln
15.58%
jan 1, 1997
6.43 trl
+95.133 bln
1.5%
jan 1, 1998
5.885 trl
-544.75 bln
-8.47%
jan 1, 1999
6.041 trl
+155.656 bln
2.64%
jan 1, 2000
6.021 trl
-19.795 bln
-0.33%
jan 1, 2001
5.467 trl
-553.696 bln
-9.2%
jan 1, 2002
5.53 trl
+62.751 bln
1.15%
jan 1, 2003
5.984 trl
+454.323 bln
8.22%
jan 1, 2004
7.388 trl
+1.404 trl
23.46%
jan 1, 2005
8.525 trl
+1.137 trl
15.39%
jan 1, 2006
8.826 trl
+300.841 bln
3.53%
jan 1, 2007
9.4 trl
+573.512 bln
6.5%
jan 1, 2008
10.785 trl
+1.385 trl
14.74%
jan 1, 2009
11.683 trl
+898.223 bln
8.33%
jan 1, 2010
10.649 trl
-1.034 trl
-8.85%
jan 1, 2011
10.465 trl
-184.084 bln
-1.73%
jan 1, 2012
11.276 trl
+810.437 bln
7.74%
jan 1, 2013
10.426 trl
-849.68 bln
-7.54%
jan 1, 2014
10.876 trl
+449.678 bln
4.31%
jan 1, 2015
11.093 trl
+217.19 bln
2.0%
Ranking of countries by current statistics by years


Comments: