29
/
en
AIzaSyAYiBZKx7MnpbEhh9jyipgxe19OcubqV5w
April 1, 2024
162139
Jamaica
JAM
true
2
1
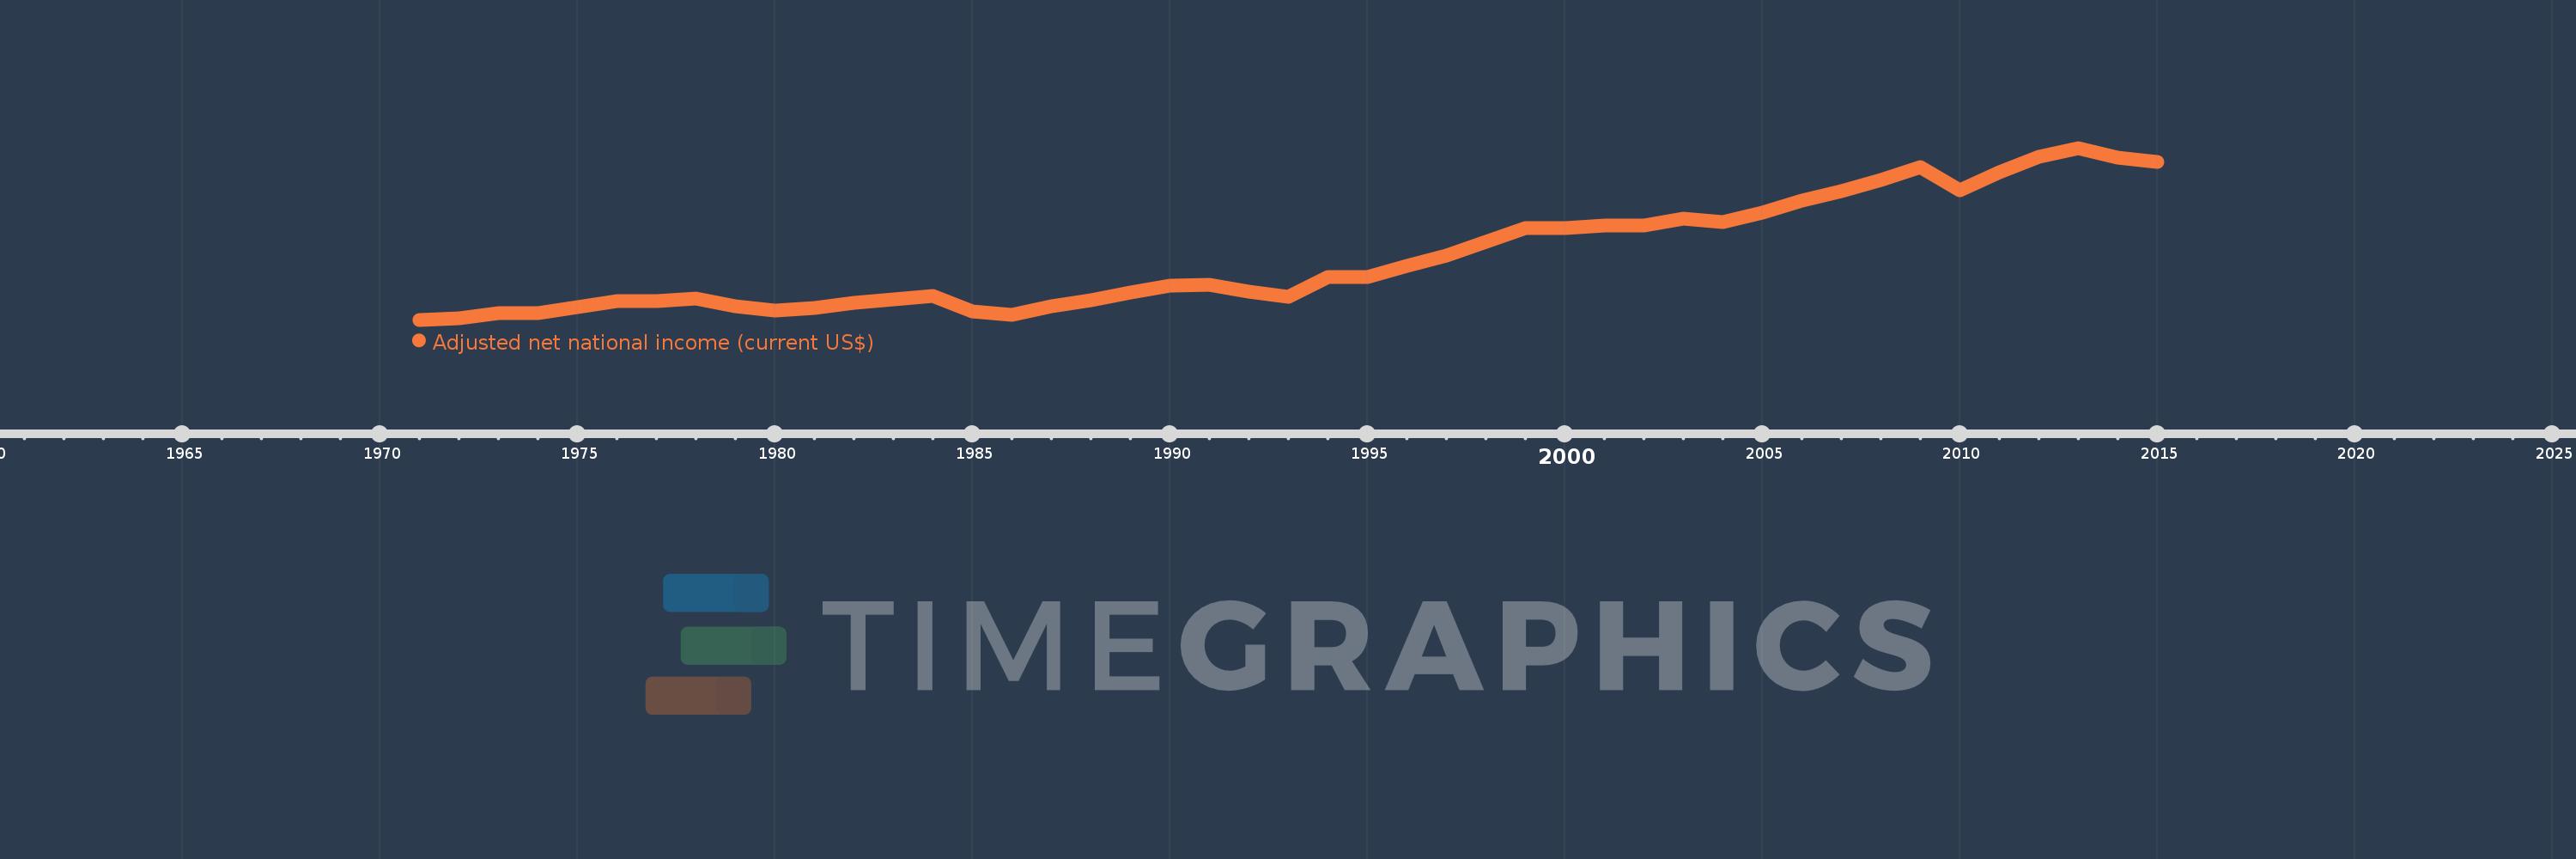
Adjusted net national income (current US$)
2015,2014,2013,2012,2011,2010,2009,2008,2007,2006,2005,2004,2003,2002,2001,2000,1999,1998,1997,1996,1995,1994,1993,1992,1991,1990,1989,1988,1987,1986,1985,1984,1983,1982,1981,1980,1979,1978,1977,1976,1975,1974,1973,1972,1971
This statistics in other country:
AfghanistanAlbaniaAlgeriaAngolaArab WorldArgentinaArmeniaAustraliaAustriaAzerbaijanBahamas, TheBahrainBangladeshBarbadosBelarusBelgiumBelizeBeninBhutanBoliviaBotswanaBrazilBrunei DarussalamBulgariaBurkina FasoBurundiCabo VerdeCambodiaCameroonCanadaCaribbean small statesCentral African RepublicCentral Europe and the BalticsChadChileChinaColombiaComorosCongo, Dem. Rep.Congo, Rep.Costa RicaCote d'IvoireCroatiaCubaCyprusCzech RepublicDenmarkDjiboutiDominicaDominican RepublicEarly-demographic dividendEast Asia & PacificEast Asia & Pacific (excluding high income)East Asia & Pacific (IDA & IBRD countries)EcuadorEgypt, Arab Rep.El SalvadorEquatorial GuineaEritreaEstoniaEthiopiaEuro areaEurope & Central AsiaEurope & Central Asia (excluding high income)Europe & Central Asia (IDA & IBRD countries)European UnionFijiFinlandFragile and conflict affected situationsFranceGabonGambia, TheGeorgiaGermanyGhanaGreeceGuatemalaGuineaGuinea-BissauGuyanaHaitiHeavily indebted poor countries (HIPC)High incomeHondurasHong Kong SAR, ChinaHungaryIBRD onlyIcelandIDA & IBRD totalIDA blendIDA onlyIDA totalIndiaIndonesiaIran, Islamic Rep.IraqIrelandIsraelItalyJamaicaJapanJordanKazakhstanKenyaKiribatiKorea, Rep.KuwaitKyrgyz RepublicLao PDRLate-demographic dividendLatin America & Caribbean Latin America & Caribbean (excluding high income)Latin America & the Caribbean (IDA & IBRD countries)LatviaLeast developed countries: UN classificationLebanonLesothoLiberiaLibyaLithuaniaLow & middle incomeLow incomeLower middle incomeLuxembourgMacedonia, FYRMadagascarMalawiMalaysiaMaldivesMaliMauritaniaMauritiusMexicoMiddle East & North AfricaMiddle East & North Africa (excluding high income)Middle East & North Africa (IDA & IBRD countries)Middle incomeMoldovaMongoliaMoroccoMozambiqueMyanmarNamibiaNepalNetherlandsNew ZealandNicaraguaNigerNigeriaNorth AmericaNorwayOECD membersOmanOther small statesPacific island small statesPakistanPanamaPapua New GuineaParaguayPeruPhilippinesPolandPortugalPost-demographic dividendPre-demographic dividendQatarRomaniaRussian FederationRwandaSamoaSao Tome and PrincipeSaudi ArabiaSenegalSeychellesSierra LeoneSingaporeSlovak RepublicSloveniaSmall statesSolomon IslandsSouth AfricaSouth AsiaSouth Asia (IDA & IBRD)SpainSri LankaSt. LuciaSt. Vincent and the GrenadinesSub-Saharan Africa Sub-Saharan Africa (excluding high income)Sub-Saharan Africa (IDA & IBRD countries)SudanSurinameSwazilandSwedenSwitzerlandSyrian Arab RepublicTajikistanTanzaniaThailandTogoTongaTrinidad and TobagoTunisiaTurkeyTurkmenistanUgandaUkraineUnited Arab EmiratesUnited KingdomUnited StatesUpper middle incomeUruguayUzbekistanVanuatuVenezuela, RBVietnamWorldYemen, Rep.ZambiaZimbabwe Timeline:
This timeline shows a graph from 1971 to 2015 of Jamaica. No data until 1970. Number of actual observations by date: 45.
Source name:
World Development Indicators
Source organization:
World Bank staff estimates based on sources and methods in World Bank's "The Changing Wealth of Nations: Measuring Sustainable Development in the New Millennium" (2011).
Categories, topics:
Economy & Growth
Last updated:
apr 23, 2017
Indicators value changes by year
Minimum:
1.192 bln
jan 1, 1971
Maximum:
13.27 bln
jan 1, 2013
At the date of observation
Value
Absolute change
Change from previous value
jan 1, 1971
1.192 bln
+1.192 bln
0.0%
jan 1, 1972
1.28 bln
+87.526 mln
7.34%
jan 1, 1973
1.65 bln
+369.984 mln
28.91%
jan 1, 1974
1.67 bln
+20.775 mln
1.26%
jan 1, 1975
2.09 bln
+419.598 mln
25.12%
jan 1, 1976
2.531 bln
+440.529 mln
21.08%
jan 1, 1977
2.482 bln
-48.094 mln
-1.9%
jan 1, 1978
2.661 bln
+178.651 mln
7.2%
jan 1, 1979
2.134 bln
-527.436 mln
-19.82%
jan 1, 1980
1.853 bln
-280.823 mln
-13.16%
jan 1, 1981
2.029 bln
+175.946 mln
9.5%
jan 1, 1982
2.356 bln
+327.247 mln
16.13%
jan 1, 1983
2.649 bln
+292.479 mln
12.41%
jan 1, 1984
2.883 bln
+234.179 mln
8.84%
jan 1, 1985
1.753 bln
-1.129 bln
-39.17%
jan 1, 1986
1.546 bln
-207.54 mln
-11.84%
jan 1, 1987
2.136 bln
+590.173 mln
38.18%
jan 1, 1988
2.588 bln
+452.091 mln
21.16%
jan 1, 1989
3.101 bln
+513.061 mln
19.82%
jan 1, 1990
3.602 bln
+501.019 mln
16.16%
jan 1, 1991
3.659 bln
+56.55 mln
1.57%
jan 1, 1992
3.17 bln
-488.986 mln
-13.36%
jan 1, 1993
2.831 bln
-338.515 mln
-10.68%
jan 1, 1994
4.197 bln
+1.366 bln
48.24%
jan 1, 1995
4.168 bln
-28.553 mln
-0.68%
jan 1, 1996
4.993 bln
+824.884 mln
19.79%
jan 1, 1997
5.704 bln
+710.462 mln
14.23%
jan 1, 1998
6.647 bln
+943.238 mln
16.54%
jan 1, 1999
7.66 bln
+1.012 bln
15.23%
jan 1, 2000
7.658 bln
-1.426 mln
-0.02%
jan 1, 2001
7.789 bln
+131.26 mln
1.71%
jan 1, 2002
7.842 bln
+52.436 mln
0.67%
jan 1, 2003
8.284 bln
+442.189 mln
5.64%
jan 1, 2004
8.05 bln
-233.812 mln
-2.82%
jan 1, 2005
8.715 bln
+665.081 mln
8.26%
jan 1, 2006
9.569 bln
+854.176 mln
9.8%
jan 1, 2007
10.229 bln
+659.611 mln
6.89%
jan 1, 2008
10.993 bln
+763.506 mln
7.46%
jan 1, 2009
11.915 bln
+922.175 mln
8.39%
jan 1, 2010
10.315 bln
-1.599 bln
-13.42%
jan 1, 2011
11.532 bln
+1.217 bln
11.8%
jan 1, 2012
12.632 bln
+1.1 bln
9.54%
jan 1, 2013
13.27 bln
+638.369 mln
5.05%
jan 1, 2014
12.604 bln
-666.178 mln
-5.02%
jan 1, 2015
12.311 bln
-293.05 mln
-2.33%
Ranking of countries by current statistics by years


Comments: