29
/
en
AIzaSyAYiBZKx7MnpbEhh9jyipgxe19OcubqV5w
April 1, 2024
116576
Cyprus
CYP
true
2
1
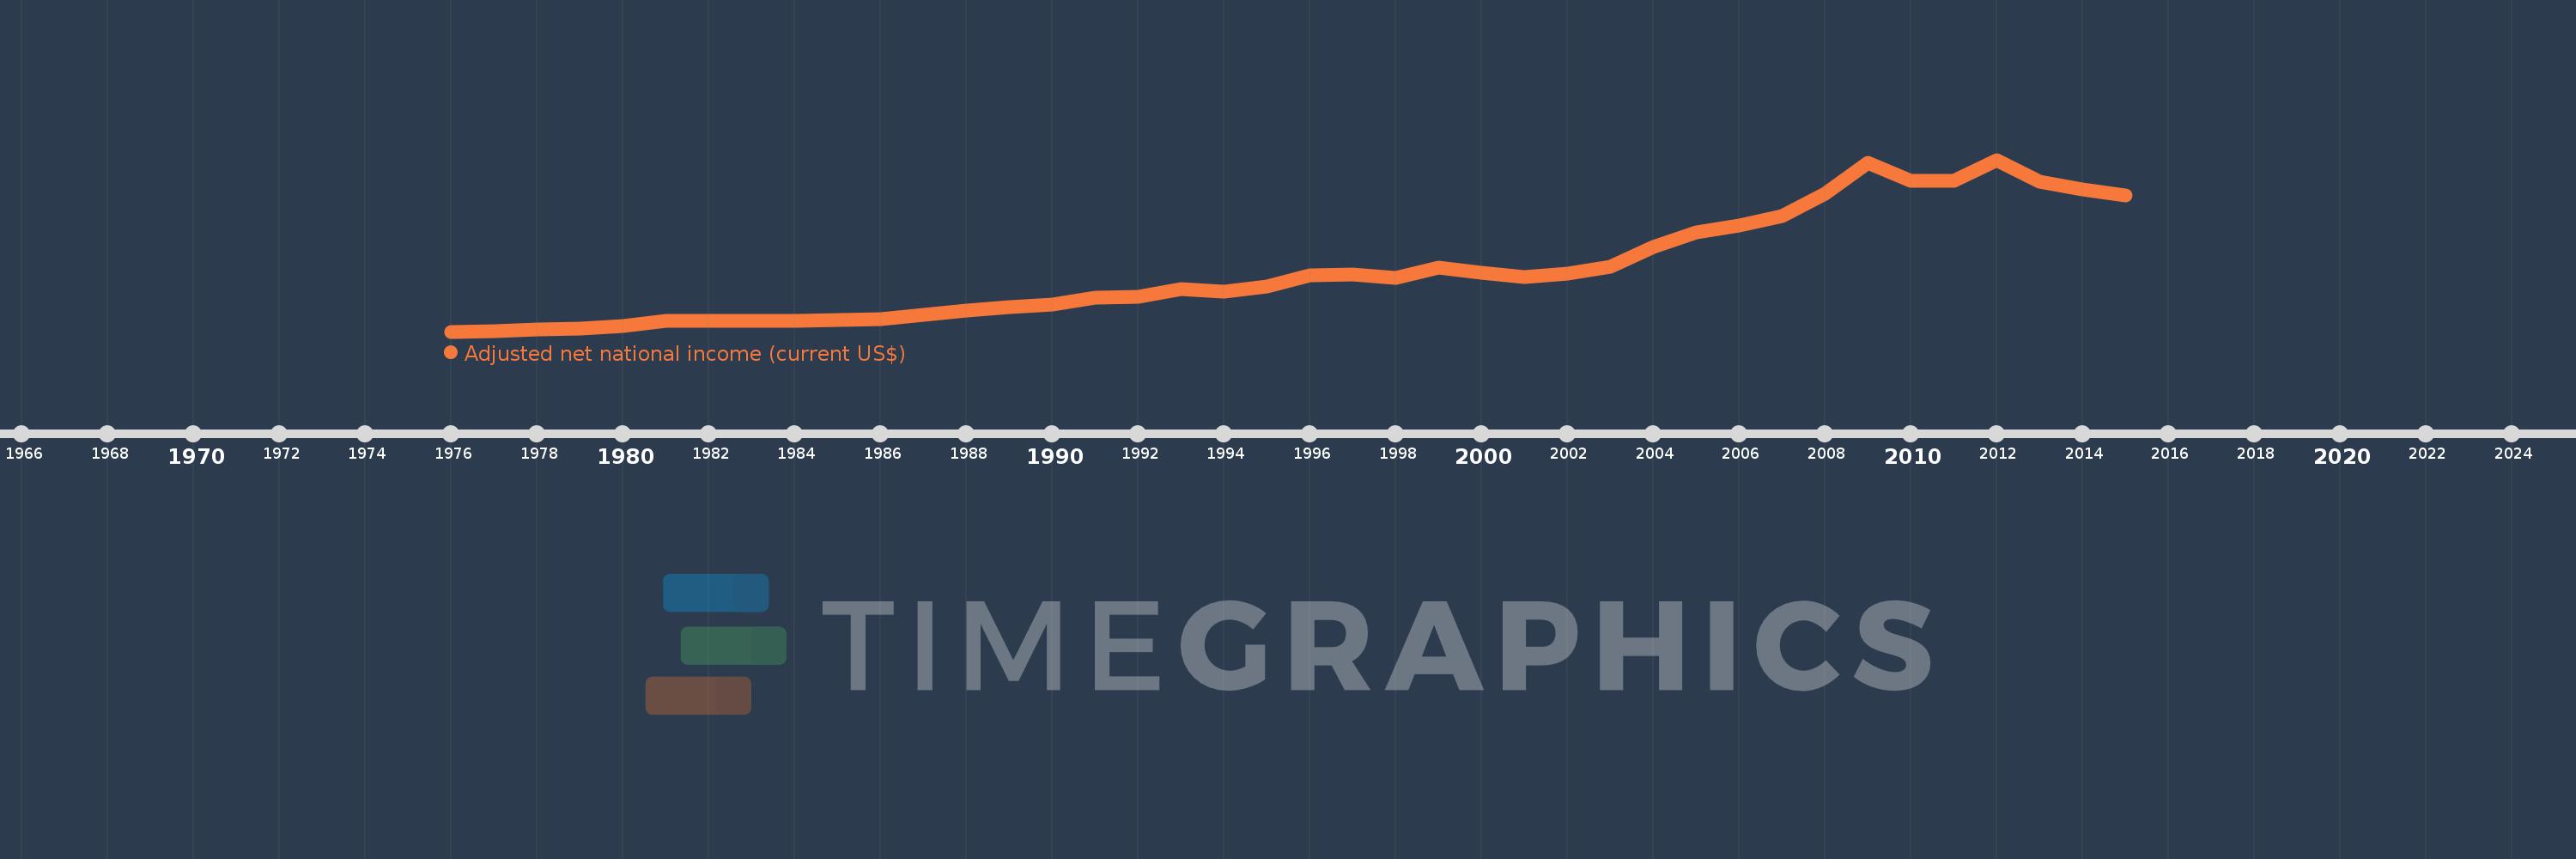
Adjusted net national income (current US$)
2015,2014,2013,2012,2011,2010,2009,2008,2007,2006,2005,2004,2003,2002,2001,2000,1999,1998,1997,1996,1995,1994,1993,1992,1991,1990,1989,1988,1987,1986,1985,1984,1983,1982,1981,1980,1979,1978,1977,1976
This statistics in other country:
AfghanistanAlbaniaAlgeriaAngolaArab WorldArgentinaArmeniaAustraliaAustriaAzerbaijanBahamas, TheBahrainBangladeshBarbadosBelarusBelgiumBelizeBeninBhutanBoliviaBotswanaBrazilBrunei DarussalamBulgariaBurkina FasoBurundiCabo VerdeCambodiaCameroonCanadaCaribbean small statesCentral African RepublicCentral Europe and the BalticsChadChileChinaColombiaComorosCongo, Dem. Rep.Congo, Rep.Costa RicaCote d'IvoireCroatiaCubaCyprusCzech RepublicDenmarkDjiboutiDominicaDominican RepublicEarly-demographic dividendEast Asia & PacificEast Asia & Pacific (excluding high income)East Asia & Pacific (IDA & IBRD countries)EcuadorEgypt, Arab Rep.El SalvadorEquatorial GuineaEritreaEstoniaEthiopiaEuro areaEurope & Central AsiaEurope & Central Asia (excluding high income)Europe & Central Asia (IDA & IBRD countries)European UnionFijiFinlandFragile and conflict affected situationsFranceGabonGambia, TheGeorgiaGermanyGhanaGreeceGuatemalaGuineaGuinea-BissauGuyanaHaitiHeavily indebted poor countries (HIPC)High incomeHondurasHong Kong SAR, ChinaHungaryIBRD onlyIcelandIDA & IBRD totalIDA blendIDA onlyIDA totalIndiaIndonesiaIran, Islamic Rep.IraqIrelandIsraelItalyJamaicaJapanJordanKazakhstanKenyaKiribatiKorea, Rep.KuwaitKyrgyz RepublicLao PDRLate-demographic dividendLatin America & Caribbean Latin America & Caribbean (excluding high income)Latin America & the Caribbean (IDA & IBRD countries)LatviaLeast developed countries: UN classificationLebanonLesothoLiberiaLibyaLithuaniaLow & middle incomeLow incomeLower middle incomeLuxembourgMacedonia, FYRMadagascarMalawiMalaysiaMaldivesMaliMauritaniaMauritiusMexicoMiddle East & North AfricaMiddle East & North Africa (excluding high income)Middle East & North Africa (IDA & IBRD countries)Middle incomeMoldovaMongoliaMoroccoMozambiqueMyanmarNamibiaNepalNetherlandsNew ZealandNicaraguaNigerNigeriaNorth AmericaNorwayOECD membersOmanOther small statesPacific island small statesPakistanPanamaPapua New GuineaParaguayPeruPhilippinesPolandPortugalPost-demographic dividendPre-demographic dividendQatarRomaniaRussian FederationRwandaSamoaSao Tome and PrincipeSaudi ArabiaSenegalSeychellesSierra LeoneSingaporeSlovak RepublicSloveniaSmall statesSolomon IslandsSouth AfricaSouth AsiaSouth Asia (IDA & IBRD)SpainSri LankaSt. LuciaSt. Vincent and the GrenadinesSub-Saharan Africa Sub-Saharan Africa (excluding high income)Sub-Saharan Africa (IDA & IBRD countries)SudanSurinameSwazilandSwedenSwitzerlandSyrian Arab RepublicTajikistanTanzaniaThailandTogoTongaTrinidad and TobagoTunisiaTurkeyTurkmenistanUgandaUkraineUnited Arab EmiratesUnited KingdomUnited StatesUpper middle incomeUruguayUzbekistanVanuatuVenezuela, RBVietnamWorldYemen, Rep.ZambiaZimbabwe Timeline:
This timeline shows a graph from 1976 to 2015 of Cyprus. No data until 1975. Number of actual observations by date: 40.
Source name:
World Development Indicators
Source organization:
World Bank staff estimates based on sources and methods in World Bank's "The Changing Wealth of Nations: Measuring Sustainable Development in the New Millennium" (2011).
Categories, topics:
Economy & Growth
Last updated:
apr 23, 2017
Indicators value changes by year
Minimum:
448.679 mln
jan 1, 1976
Maximum:
24.162 bln
jan 1, 2012
At the date of observation
Value
Absolute change
Change from previous value
jan 1, 1976
448.679 mln
+448.679 mln
0.0%
jan 1, 1977
527.758 mln
+79.079 mln
17.62%
jan 1, 1978
689.589 mln
+161.831 mln
30.66%
jan 1, 1979
900.502 mln
+210.912 mln
30.59%
jan 1, 1980
1.195 bln
+294.61 mln
32.72%
jan 1, 1981
1.99 bln
+794.872 mln
66.51%
jan 1, 1982
1.905 bln
-84.572 mln
-4.25%
jan 1, 1983
1.967 bln
+61.882 mln
3.25%
jan 1, 1984
1.935 bln
-32.133 mln
-1.63%
jan 1, 1985
2.045 bln
+109.713 mln
5.67%
jan 1, 1986
2.177 bln
+132.561 mln
6.48%
jan 1, 1987
2.77 bln
+592.501 mln
27.21%
jan 1, 1988
3.364 bln
+594.081 mln
21.45%
jan 1, 1989
3.884 bln
+520.192 mln
15.46%
jan 1, 1990
4.152 bln
+267.744 mln
6.89%
jan 1, 1991
5.089 bln
+937.278 mln
22.57%
jan 1, 1992
5.255 bln
+165.787 mln
3.26%
jan 1, 1993
6.27 bln
+1.015 bln
19.31%
jan 1, 1994
5.989 bln
-280.853 mln
-4.48%
jan 1, 1995
6.729 bln
+739.888 mln
12.35%
jan 1, 1996
8.244 bln
+1.515 bln
22.51%
jan 1, 1997
8.3 bln
+56.337 mln
0.68%
jan 1, 1998
7.817 bln
-482.959 mln
-5.82%
jan 1, 1999
9.298 bln
+1.481 bln
18.95%
jan 1, 2000
8.607 bln
-690.732 mln
-7.43%
jan 1, 2001
7.931 bln
-676.456 mln
-7.86%
jan 1, 2002
8.415 bln
+483.696 mln
6.1%
jan 1, 2003
9.432 bln
+1.017 bln
12.09%
jan 1, 2004
12.116 bln
+2.684 bln
28.46%
jan 1, 2005
14.109 bln
+1.994 bln
16.45%
jan 1, 2006
15.114 bln
+1.005 bln
7.12%
jan 1, 2007
16.406 bln
+1.292 bln
8.55%
jan 1, 2008
19.449 bln
+3.043 bln
18.55%
jan 1, 2009
23.728 bln
+4.279 bln
22.0%
jan 1, 2010
21.304 bln
-2.424 bln
-10.22%
jan 1, 2011
21.297 bln
-6.579 mln
-0.03%
jan 1, 2012
24.162 bln
+2.865 bln
13.45%
jan 1, 2013
21.181 bln
-2.982 bln
-12.34%
jan 1, 2014
20.11 bln
-1.071 bln
-5.06%
jan 1, 2015
19.206 bln
-904.491 mln
-4.5%
Ranking of countries by current statistics by years


Comments: