29
/
en
AIzaSyAYiBZKx7MnpbEhh9jyipgxe19OcubqV5w
April 1, 2024
141486
Greece
GRC
true
2
1
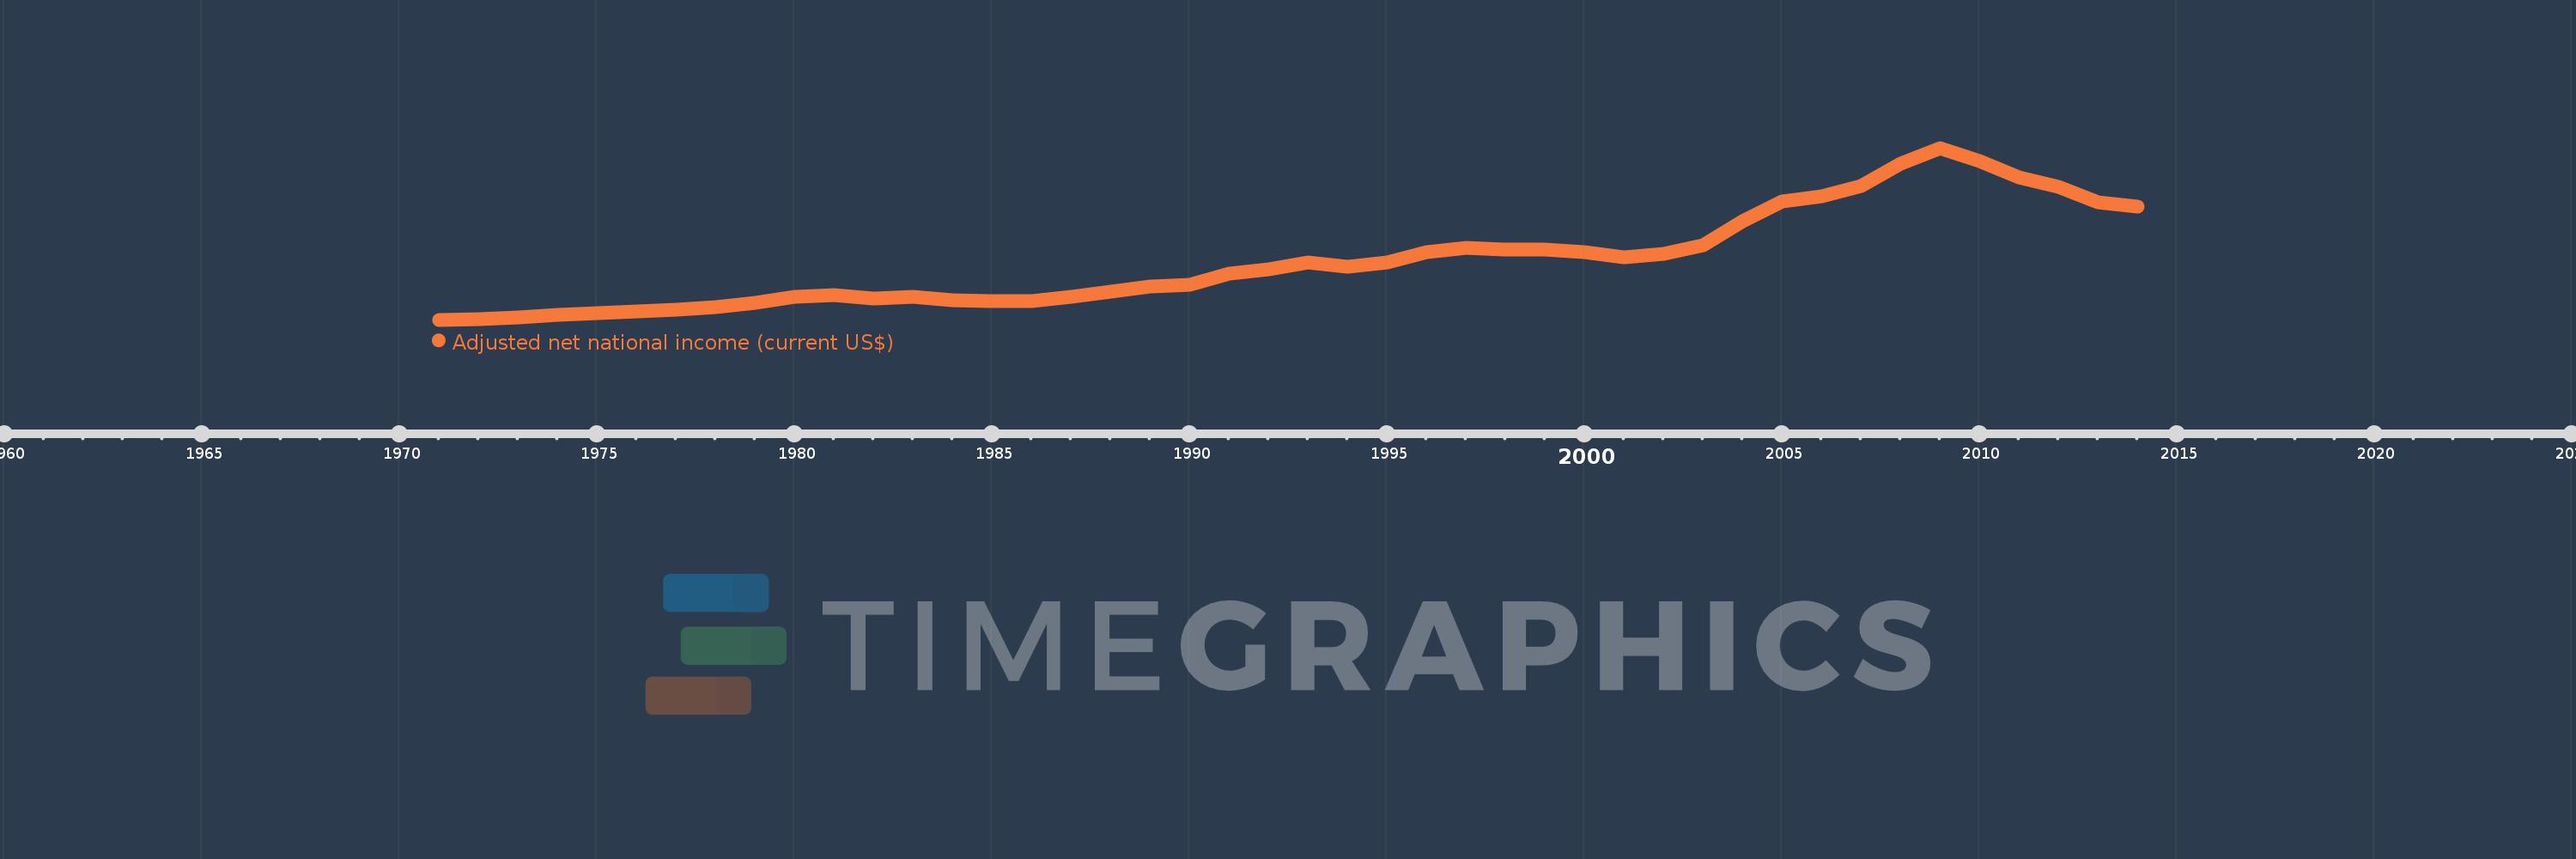
Adjusted net national income (current US$)
2014,2013,2012,2011,2010,2009,2008,2007,2006,2005,2004,2003,2002,2001,2000,1999,1998,1997,1996,1995,1994,1993,1992,1991,1990,1989,1988,1987,1986,1985,1984,1983,1982,1981,1980,1979,1978,1977,1976,1975,1974,1973,1972,1971
This statistics in other country:
AfghanistanAlbaniaAlgeriaAngolaArab WorldArgentinaArmeniaAustraliaAustriaAzerbaijanBahamas, TheBahrainBangladeshBarbadosBelarusBelgiumBelizeBeninBhutanBoliviaBotswanaBrazilBrunei DarussalamBulgariaBurkina FasoBurundiCabo VerdeCambodiaCameroonCanadaCaribbean small statesCentral African RepublicCentral Europe and the BalticsChadChileChinaColombiaComorosCongo, Dem. Rep.Congo, Rep.Costa RicaCote d'IvoireCroatiaCubaCyprusCzech RepublicDenmarkDjiboutiDominicaDominican RepublicEarly-demographic dividendEast Asia & PacificEast Asia & Pacific (excluding high income)East Asia & Pacific (IDA & IBRD countries)EcuadorEgypt, Arab Rep.El SalvadorEquatorial GuineaEritreaEstoniaEthiopiaEuro areaEurope & Central AsiaEurope & Central Asia (excluding high income)Europe & Central Asia (IDA & IBRD countries)European UnionFijiFinlandFragile and conflict affected situationsFranceGabonGambia, TheGeorgiaGermanyGhanaGreeceGuatemalaGuineaGuinea-BissauGuyanaHaitiHeavily indebted poor countries (HIPC)High incomeHondurasHong Kong SAR, ChinaHungaryIBRD onlyIcelandIDA & IBRD totalIDA blendIDA onlyIDA totalIndiaIndonesiaIran, Islamic Rep.IraqIrelandIsraelItalyJamaicaJapanJordanKazakhstanKenyaKiribatiKorea, Rep.KuwaitKyrgyz RepublicLao PDRLate-demographic dividendLatin America & Caribbean Latin America & Caribbean (excluding high income)Latin America & the Caribbean (IDA & IBRD countries)LatviaLeast developed countries: UN classificationLebanonLesothoLiberiaLibyaLithuaniaLow & middle incomeLow incomeLower middle incomeLuxembourgMacedonia, FYRMadagascarMalawiMalaysiaMaldivesMaliMauritaniaMauritiusMexicoMiddle East & North AfricaMiddle East & North Africa (excluding high income)Middle East & North Africa (IDA & IBRD countries)Middle incomeMoldovaMongoliaMoroccoMozambiqueMyanmarNamibiaNepalNetherlandsNew ZealandNicaraguaNigerNigeriaNorth AmericaNorwayOECD membersOmanOther small statesPacific island small statesPakistanPanamaPapua New GuineaParaguayPeruPhilippinesPolandPortugalPost-demographic dividendPre-demographic dividendQatarRomaniaRussian FederationRwandaSamoaSao Tome and PrincipeSaudi ArabiaSenegalSeychellesSierra LeoneSingaporeSlovak RepublicSloveniaSmall statesSolomon IslandsSouth AfricaSouth AsiaSouth Asia (IDA & IBRD)SpainSri LankaSt. LuciaSt. Vincent and the GrenadinesSub-Saharan Africa Sub-Saharan Africa (excluding high income)Sub-Saharan Africa (IDA & IBRD countries)SudanSurinameSwazilandSwedenSwitzerlandSyrian Arab RepublicTajikistanTanzaniaThailandTogoTongaTrinidad and TobagoTunisiaTurkeyTurkmenistanUgandaUkraineUnited Arab EmiratesUnited KingdomUnited StatesUpper middle incomeUruguayUzbekistanVanuatuVenezuela, RBVietnamWorldYemen, Rep.ZambiaZimbabwe Timeline:
This timeline shows a graph from 1971 to 2014 of Greece. No data until 1970. Number of actual observations by date: 44.
Source name:
World Development Indicators
Source organization:
World Bank staff estimates based on sources and methods in World Bank's "The Changing Wealth of Nations: Measuring Sustainable Development in the New Millennium" (2011).
Categories, topics:
Economy & Growth
Last updated:
apr 23, 2017
Indicators value changes by year
Minimum:
12.269 bln
jan 1, 1971
Maximum:
292.269 bln
jan 1, 2009
At the date of observation
Value
Absolute change
Change from previous value
jan 1, 1971
12.269 bln
+12.269 bln
0.0%
jan 1, 1972
13.639 bln
+1.369 bln
11.16%
jan 1, 1973
15.705 bln
+2.067 bln
15.15%
jan 1, 1974
20.774 bln
+5.068 bln
32.27%
jan 1, 1975
23.579 bln
+2.805 bln
13.5%
jan 1, 1976
26.371 bln
+2.793 bln
11.84%
jan 1, 1977
28.84 bln
+2.469 bln
9.36%
jan 1, 1978
33.348 bln
+4.508 bln
15.63%
jan 1, 1979
40.504 bln
+7.155 bln
21.46%
jan 1, 1980
49.806 bln
+9.302 bln
22.97%
jan 1, 1981
51.815 bln
+2.009 bln
4.03%
jan 1, 1982
47.237 bln
-4.578 bln
-8.84%
jan 1, 1983
49.39 bln
+2.154 bln
4.56%
jan 1, 1984
44.159 bln
-5.232 bln
-10.59%
jan 1, 1985
42.508 bln
-1.651 bln
-3.74%
jan 1, 1986
42.166 bln
-341.945 mln
-0.8%
jan 1, 1987
49.201 bln
+7.036 bln
16.69%
jan 1, 1988
57.618 bln
+8.417 bln
17.11%
jan 1, 1989
67.101 bln
+9.483 bln
16.46%
jan 1, 1990
69.869 bln
+2.768 bln
4.13%
jan 1, 1991
88.042 bln
+18.172 bln
26.01%
jan 1, 1992
95.047 bln
+7.005 bln
7.96%
jan 1, 1993
105.242 bln
+10.195 bln
10.73%
jan 1, 1994
98.181 bln
-7.06 bln
-6.71%
jan 1, 1995
105.128 bln
+6.946 bln
7.07%
jan 1, 1996
123.011 bln
+17.883 bln
17.01%
jan 1, 1997
129.423 bln
+6.413 bln
5.21%
jan 1, 1998
126.613 bln
-2.811 bln
-2.17%
jan 1, 1999
127.03 bln
+417.605 mln
0.33%
jan 1, 2000
123.143 bln
-3.887 bln
-3.06%
jan 1, 2001
114.477 bln
-8.667 bln
-7.04%
jan 1, 2002
119.738 bln
+5.262 bln
4.6%
jan 1, 2003
134.314 bln
+14.576 bln
12.17%
jan 1, 2004
173.405 bln
+39.09 bln
29.1%
jan 1, 2005
205.035 bln
+31.63 bln
18.24%
jan 1, 2006
213.689 bln
+8.655 bln
4.22%
jan 1, 2007
230.52 bln
+16.831 bln
7.88%
jan 1, 2008
266.153 bln
+35.633 bln
15.46%
jan 1, 2009
292.269 bln
+26.116 bln
9.81%
jan 1, 2010
271.041 bln
-21.228 bln
-7.26%
jan 1, 2011
243.571 bln
-27.469 bln
-10.13%
jan 1, 2012
228.539 bln
-15.032 bln
-6.17%
jan 1, 2013
203.286 bln
-25.253 bln
-11.05%
jan 1, 2014
196.195 bln
-7.091 bln
-3.49%
Ranking of countries by current statistics by years


Comments: