29
/
en
AIzaSyAYiBZKx7MnpbEhh9jyipgxe19OcubqV5w
April 1, 2024
277285
Uruguay
URY
true
2
1
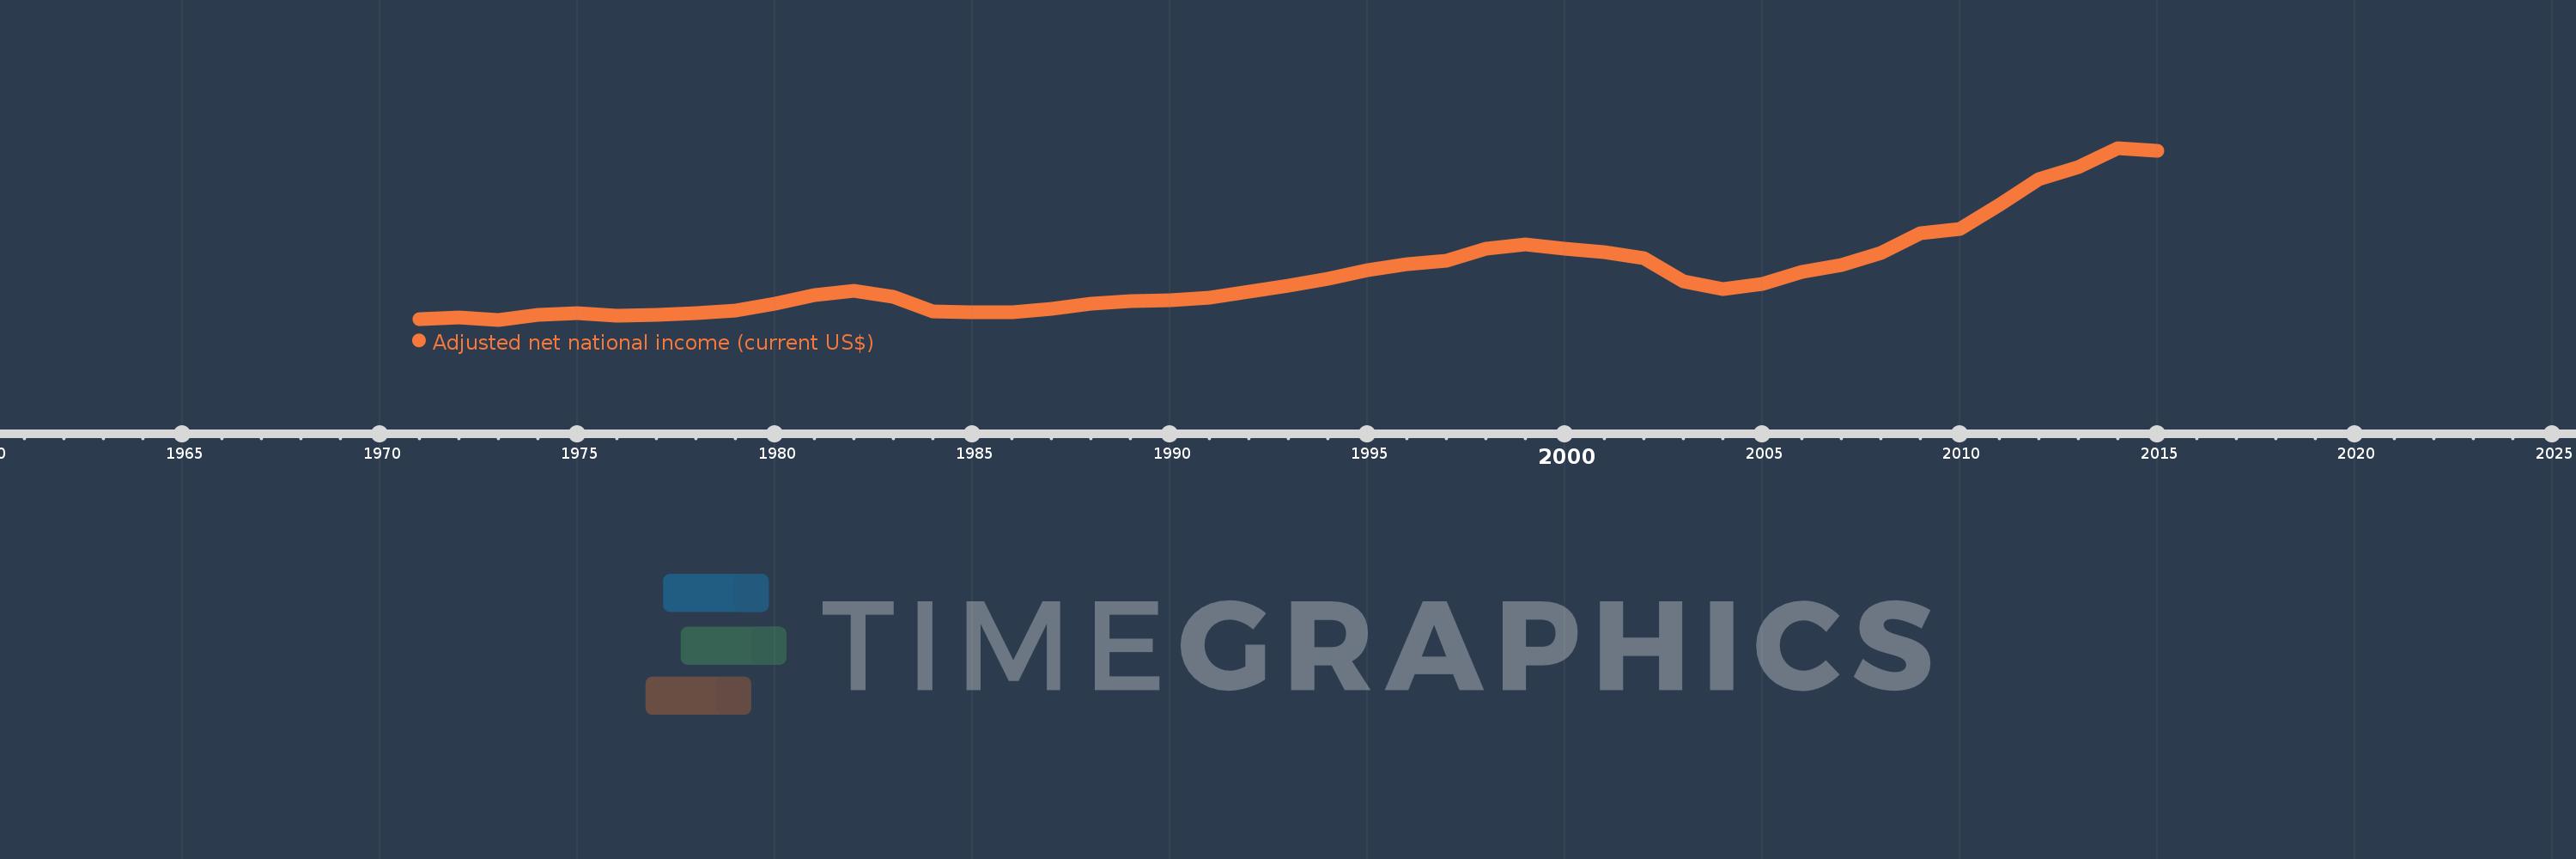
Adjusted net national income (current US$)
2015,2014,2013,2012,2011,2010,2009,2008,2007,2006,2005,2004,2003,2002,2001,2000,1999,1998,1997,1996,1995,1994,1993,1992,1991,1990,1989,1988,1987,1986,1985,1984,1983,1982,1981,1980,1979,1978,1977,1976,1975,1974,1973,1972,1971
This statistics in other country:
AfghanistanAlbaniaAlgeriaAngolaArab WorldArgentinaArmeniaAustraliaAustriaAzerbaijanBahamas, TheBahrainBangladeshBarbadosBelarusBelgiumBelizeBeninBhutanBoliviaBotswanaBrazilBrunei DarussalamBulgariaBurkina FasoBurundiCabo VerdeCambodiaCameroonCanadaCaribbean small statesCentral African RepublicCentral Europe and the BalticsChadChileChinaColombiaComorosCongo, Dem. Rep.Congo, Rep.Costa RicaCote d'IvoireCroatiaCubaCyprusCzech RepublicDenmarkDjiboutiDominicaDominican RepublicEarly-demographic dividendEast Asia & PacificEast Asia & Pacific (excluding high income)East Asia & Pacific (IDA & IBRD countries)EcuadorEgypt, Arab Rep.El SalvadorEquatorial GuineaEritreaEstoniaEthiopiaEuro areaEurope & Central AsiaEurope & Central Asia (excluding high income)Europe & Central Asia (IDA & IBRD countries)European UnionFijiFinlandFragile and conflict affected situationsFranceGabonGambia, TheGeorgiaGermanyGhanaGreeceGuatemalaGuineaGuinea-BissauGuyanaHaitiHeavily indebted poor countries (HIPC)High incomeHondurasHong Kong SAR, ChinaHungaryIBRD onlyIcelandIDA & IBRD totalIDA blendIDA onlyIDA totalIndiaIndonesiaIran, Islamic Rep.IraqIrelandIsraelItalyJamaicaJapanJordanKazakhstanKenyaKiribatiKorea, Rep.KuwaitKyrgyz RepublicLao PDRLate-demographic dividendLatin America & Caribbean Latin America & Caribbean (excluding high income)Latin America & the Caribbean (IDA & IBRD countries)LatviaLeast developed countries: UN classificationLebanonLesothoLiberiaLibyaLithuaniaLow & middle incomeLow incomeLower middle incomeLuxembourgMacedonia, FYRMadagascarMalawiMalaysiaMaldivesMaliMauritaniaMauritiusMexicoMiddle East & North AfricaMiddle East & North Africa (excluding high income)Middle East & North Africa (IDA & IBRD countries)Middle incomeMoldovaMongoliaMoroccoMozambiqueMyanmarNamibiaNepalNetherlandsNew ZealandNicaraguaNigerNigeriaNorth AmericaNorwayOECD membersOmanOther small statesPacific island small statesPakistanPanamaPapua New GuineaParaguayPeruPhilippinesPolandPortugalPost-demographic dividendPre-demographic dividendQatarRomaniaRussian FederationRwandaSamoaSao Tome and PrincipeSaudi ArabiaSenegalSeychellesSierra LeoneSingaporeSlovak RepublicSloveniaSmall statesSolomon IslandsSouth AfricaSouth AsiaSouth Asia (IDA & IBRD)SpainSri LankaSt. LuciaSt. Vincent and the GrenadinesSub-Saharan Africa Sub-Saharan Africa (excluding high income)Sub-Saharan Africa (IDA & IBRD countries)SudanSurinameSwazilandSwedenSwitzerlandSyrian Arab RepublicTajikistanTanzaniaThailandTogoTongaTrinidad and TobagoTunisiaTurkeyTurkmenistanUgandaUkraineUnited Arab EmiratesUnited KingdomUnited StatesUpper middle incomeUruguayUzbekistanVanuatuVenezuela, RBVietnamWorldYemen, Rep.ZambiaZimbabwe Timeline:
This timeline shows a graph from 1971 to 2015 of Uruguay. No data until 1970. Number of actual observations by date: 45.
Source name:
World Development Indicators
Source organization:
World Bank staff estimates based on sources and methods in World Bank's "The Changing Wealth of Nations: Measuring Sustainable Development in the New Millennium" (2011).
Categories, topics:
Economy & Growth
Last updated:
apr 23, 2017
Indicators value changes by year
Minimum:
1.998 bln
jan 1, 1973
Maximum:
49.225 bln
jan 1, 2014
At the date of observation
Value
Absolute change
Change from previous value
jan 1, 1971
2.219 bln
+2.219 bln
0.0%
jan 1, 1972
2.583 bln
+364.188 mln
16.41%
jan 1, 1973
1.998 bln
-585.863 mln
-22.68%
jan 1, 1974
3.382 bln
+1.385 bln
69.31%
jan 1, 1975
3.726 bln
+343.406 mln
10.15%
jan 1, 1976
3.165 bln
-560.386 mln
-15.04%
jan 1, 1977
3.291 bln
+126.162 mln
3.99%
jan 1, 1978
3.706 bln
+414.692 mln
12.6%
jan 1, 1979
4.442 bln
+736.355 mln
19.87%
jan 1, 1980
6.528 bln
+2.085 bln
46.94%
jan 1, 1981
8.868 bln
+2.34 bln
35.85%
jan 1, 1982
10.029 bln
+1.161 bln
13.1%
jan 1, 1983
8.214 bln
-1.815 bln
-18.1%
jan 1, 1984
4.317 bln
-3.897 bln
-47.44%
jan 1, 1985
4.011 bln
-305.881 mln
-7.09%
jan 1, 1986
3.939 bln
-72.672 mln
-1.81%
jan 1, 1987
4.968 bln
+1.029 bln
26.13%
jan 1, 1988
6.309 bln
+1.342 bln
27.01%
jan 1, 1989
7.073 bln
+763.736 mln
12.1%
jan 1, 1990
7.26 bln
+186.447 mln
2.64%
jan 1, 1991
8.021 bln
+761.739 mln
10.49%
jan 1, 1992
9.83 bln
+1.809 bln
22.55%
jan 1, 1993
11.37 bln
+1.54 bln
15.67%
jan 1, 1994
13.348 bln
+1.978 bln
17.4%
jan 1, 1995
15.538 bln
+2.19 bln
16.41%
jan 1, 1996
17.165 bln
+1.627 bln
10.47%
jan 1, 1997
18.274 bln
+1.109 bln
6.46%
jan 1, 1998
21.469 bln
+3.196 bln
17.49%
jan 1, 1999
22.721 bln
+1.251 bln
5.83%
jan 1, 2000
21.619 bln
-1.102 bln
-4.85%
jan 1, 2001
20.652 bln
-966.901 mln
-4.47%
jan 1, 2002
18.921 bln
-1.731 bln
-8.38%
jan 1, 2003
12.439 bln
-6.483 bln
-34.26%
jan 1, 2004
10.411 bln
-2.027 bln
-16.3%
jan 1, 2005
11.729 bln
+1.318 bln
12.66%
jan 1, 2006
15.09 bln
+3.361 bln
28.65%
jan 1, 2007
17.08 bln
+1.991 bln
13.19%
jan 1, 2008
20.345 bln
+3.265 bln
19.12%
jan 1, 2009
25.811 bln
+5.466 bln
26.87%
jan 1, 2010
27.029 bln
+1.218 bln
4.72%
jan 1, 2011
33.652 bln
+6.624 bln
24.51%
jan 1, 2012
40.706 bln
+7.053 bln
20.96%
jan 1, 2013
44.064 bln
+3.358 bln
8.25%
jan 1, 2014
49.225 bln
+5.16 bln
11.71%
jan 1, 2015
48.511 bln
-713.467 mln
-1.45%
Ranking of countries by current statistics by years


Comments: