29
/
en
AIzaSyAYiBZKx7MnpbEhh9jyipgxe19OcubqV5w
April 1, 2024
38698
IDA only
IDX
false
2
1
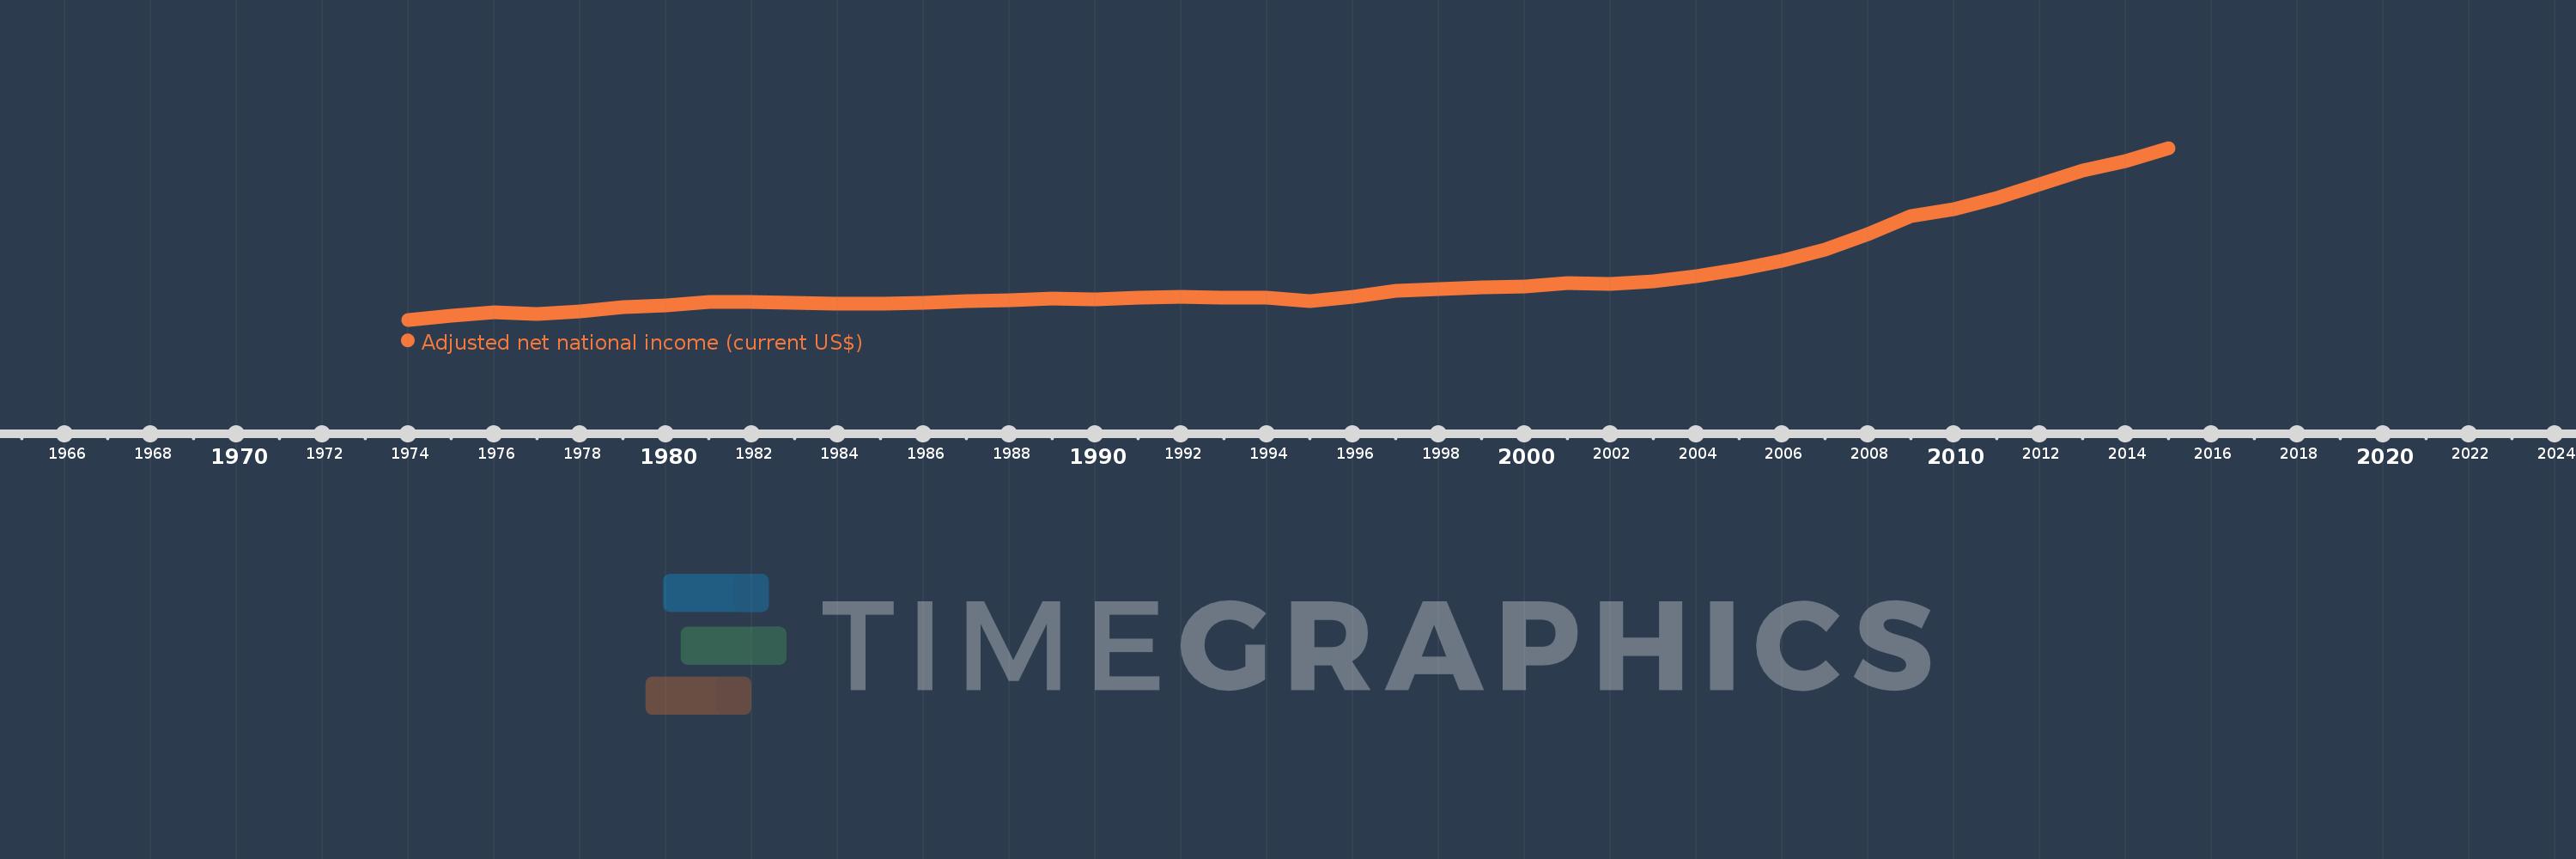
Adjusted net national income (current US$)
2015,2014,2013,2012,2011,2010,2009,2008,2007,2006,2005,2004,2003,2002,2001,2000,1999,1998,1997,1996,1995,1994,1993,1992,1991,1990,1989,1988,1987,1986,1985,1984,1983,1982,1981,1980,1979,1978,1977,1976,1975,1974
This statistics in other country:
AfghanistanAlbaniaAlgeriaAngolaArab WorldArgentinaArmeniaAustraliaAustriaAzerbaijanBahamas, TheBahrainBangladeshBarbadosBelarusBelgiumBelizeBeninBhutanBoliviaBotswanaBrazilBrunei DarussalamBulgariaBurkina FasoBurundiCabo VerdeCambodiaCameroonCanadaCaribbean small statesCentral African RepublicCentral Europe and the BalticsChadChileChinaColombiaComorosCongo, Dem. Rep.Congo, Rep.Costa RicaCote d'IvoireCroatiaCubaCyprusCzech RepublicDenmarkDjiboutiDominicaDominican RepublicEarly-demographic dividendEast Asia & PacificEast Asia & Pacific (excluding high income)East Asia & Pacific (IDA & IBRD countries)EcuadorEgypt, Arab Rep.El SalvadorEquatorial GuineaEritreaEstoniaEthiopiaEuro areaEurope & Central AsiaEurope & Central Asia (excluding high income)Europe & Central Asia (IDA & IBRD countries)European UnionFijiFinlandFragile and conflict affected situationsFranceGabonGambia, TheGeorgiaGermanyGhanaGreeceGuatemalaGuineaGuinea-BissauGuyanaHaitiHeavily indebted poor countries (HIPC)High incomeHondurasHong Kong SAR, ChinaHungaryIBRD onlyIcelandIDA & IBRD totalIDA blendIDA onlyIDA totalIndiaIndonesiaIran, Islamic Rep.IraqIrelandIsraelItalyJamaicaJapanJordanKazakhstanKenyaKiribatiKorea, Rep.KuwaitKyrgyz RepublicLao PDRLate-demographic dividendLatin America & Caribbean Latin America & Caribbean (excluding high income)Latin America & the Caribbean (IDA & IBRD countries)LatviaLeast developed countries: UN classificationLebanonLesothoLiberiaLibyaLithuaniaLow & middle incomeLow incomeLower middle incomeLuxembourgMacedonia, FYRMadagascarMalawiMalaysiaMaldivesMaliMauritaniaMauritiusMexicoMiddle East & North AfricaMiddle East & North Africa (excluding high income)Middle East & North Africa (IDA & IBRD countries)Middle incomeMoldovaMongoliaMoroccoMozambiqueMyanmarNamibiaNepalNetherlandsNew ZealandNicaraguaNigerNigeriaNorth AmericaNorwayOECD membersOmanOther small statesPacific island small statesPakistanPanamaPapua New GuineaParaguayPeruPhilippinesPolandPortugalPost-demographic dividendPre-demographic dividendQatarRomaniaRussian FederationRwandaSamoaSao Tome and PrincipeSaudi ArabiaSenegalSeychellesSierra LeoneSingaporeSlovak RepublicSloveniaSmall statesSolomon IslandsSouth AfricaSouth AsiaSouth Asia (IDA & IBRD)SpainSri LankaSt. LuciaSt. Vincent and the GrenadinesSub-Saharan Africa Sub-Saharan Africa (excluding high income)Sub-Saharan Africa (IDA & IBRD countries)SudanSurinameSwazilandSwedenSwitzerlandSyrian Arab RepublicTajikistanTanzaniaThailandTogoTongaTrinidad and TobagoTunisiaTurkeyTurkmenistanUgandaUkraineUnited Arab EmiratesUnited KingdomUnited StatesUpper middle incomeUruguayUzbekistanVanuatuVenezuela, RBVietnamWorldYemen, Rep.ZambiaZimbabwe Timeline:
This timeline shows a graph from 1974 to 2015 of IDA only. No data until 1973. Number of actual observations by date: 42.
Source name:
World Development Indicators
Source organization:
World Bank staff estimates based on sources and methods in World Bank's "The Changing Wealth of Nations: Measuring Sustainable Development in the New Millennium" (2011).
Categories, topics:
Economy & Growth
Last updated:
apr 23, 2017
Indicators value changes by year
Minimum:
62.691 bln
jan 1, 1974
Maximum:
894.865 bln
jan 1, 2015
At the date of observation
Value
Absolute change
Change from previous value
jan 1, 1974
62.691 bln
+62.691 bln
0.0%
jan 1, 1975
80.786 bln
+18.094 bln
28.86%
jan 1, 1976
99.458 bln
+18.672 bln
23.11%
jan 1, 1977
89.658 bln
-9.8 bln
-9.85%
jan 1, 1978
101.298 bln
+11.64 bln
12.98%
jan 1, 1979
122.185 bln
+20.887 bln
20.62%
jan 1, 1980
133.621 bln
+11.436 bln
9.36%
jan 1, 1981
146.883 bln
+13.262 bln
9.92%
jan 1, 1982
148.5 bln
+1.617 bln
1.1%
jan 1, 1983
145.523 bln
-2.977 bln
-2.0%
jan 1, 1984
142.022 bln
-3.501 bln
-2.41%
jan 1, 1985
139.891 bln
-2.131 bln
-1.5%
jan 1, 1986
146.308 bln
+6.417 bln
4.59%
jan 1, 1987
154.845 bln
+8.537 bln
5.83%
jan 1, 1988
158.385 bln
+3.54 bln
2.29%
jan 1, 1989
165.368 bln
+6.982 bln
4.41%
jan 1, 1990
160.996 bln
-4.372 bln
-2.64%
jan 1, 1991
171.37 bln
+10.374 bln
6.44%
jan 1, 1992
174.548 bln
+3.178 bln
1.85%
jan 1, 1993
171.402 bln
-3.146 bln
-1.8%
jan 1, 1994
171.463 bln
+60.719 mln
0.04%
jan 1, 1995
152.177 bln
-19.285 bln
-11.25%
jan 1, 1996
173.969 bln
+21.792 bln
14.32%
jan 1, 1997
202.191 bln
+28.222 bln
16.22%
jan 1, 1998
211.93 bln
+9.739 bln
4.82%
jan 1, 1999
221.484 bln
+9.554 bln
4.51%
jan 1, 2000
224.174 bln
+2.69 bln
1.21%
jan 1, 2001
240.737 bln
+16.563 bln
7.39%
jan 1, 2002
237.007 bln
-3.73 bln
-1.55%
jan 1, 2003
248.275 bln
+11.268 bln
4.75%
jan 1, 2004
271.638 bln
+23.363 bln
9.41%
jan 1, 2005
308.118 bln
+36.48 bln
13.43%
jan 1, 2006
347.676 bln
+39.558 bln
12.84%
jan 1, 2007
400.811 bln
+53.135 bln
15.28%
jan 1, 2008
477.361 bln
+76.55 bln
19.1%
jan 1, 2009
564.08 bln
+86.719 bln
18.17%
jan 1, 2010
598.482 bln
+34.402 bln
6.1%
jan 1, 2011
650.815 bln
+52.333 bln
8.74%
jan 1, 2012
717.218 bln
+66.404 bln
10.2%
jan 1, 2013
783.942 bln
+66.724 bln
9.3%
jan 1, 2014
833.004 bln
+49.062 bln
6.26%
jan 1, 2015
894.865 bln
+61.861 bln
7.43%
Ranking of countries by current statistics by years


Comments: