29
/
en
AIzaSyAYiBZKx7MnpbEhh9jyipgxe19OcubqV5w
April 1, 2024
143930
Guatemala
GTM
true
2
1
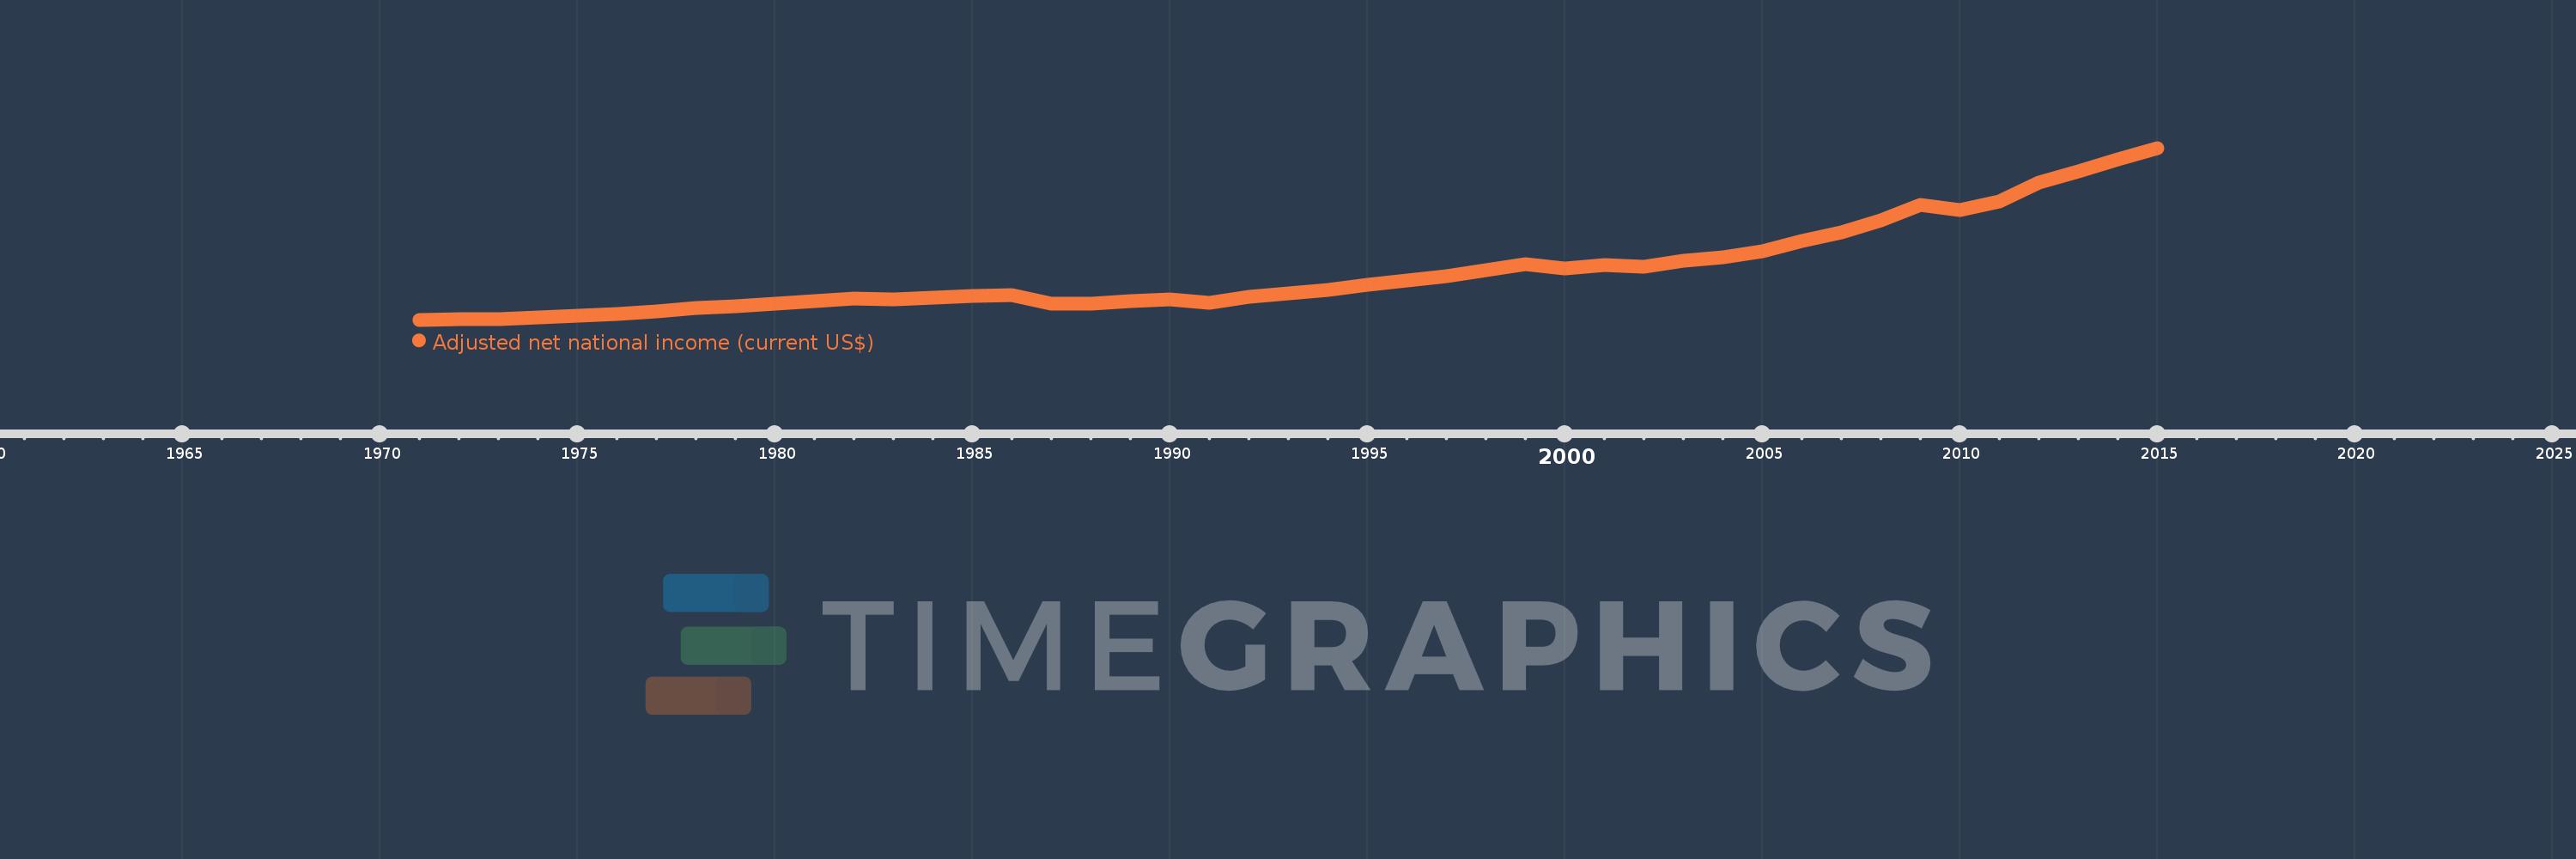
Adjusted net national income (current US$)
2015,2014,2013,2012,2011,2010,2009,2008,2007,2006,2005,2004,2003,2002,2001,2000,1999,1998,1997,1996,1995,1994,1993,1992,1991,1990,1989,1988,1987,1986,1985,1984,1983,1982,1981,1980,1979,1978,1977,1976,1975,1974,1973,1972,1971
This statistics in other country:
AfghanistanAlbaniaAlgeriaAngolaArab WorldArgentinaArmeniaAustraliaAustriaAzerbaijanBahamas, TheBahrainBangladeshBarbadosBelarusBelgiumBelizeBeninBhutanBoliviaBotswanaBrazilBrunei DarussalamBulgariaBurkina FasoBurundiCabo VerdeCambodiaCameroonCanadaCaribbean small statesCentral African RepublicCentral Europe and the BalticsChadChileChinaColombiaComorosCongo, Dem. Rep.Congo, Rep.Costa RicaCote d'IvoireCroatiaCubaCyprusCzech RepublicDenmarkDjiboutiDominicaDominican RepublicEarly-demographic dividendEast Asia & PacificEast Asia & Pacific (excluding high income)East Asia & Pacific (IDA & IBRD countries)EcuadorEgypt, Arab Rep.El SalvadorEquatorial GuineaEritreaEstoniaEthiopiaEuro areaEurope & Central AsiaEurope & Central Asia (excluding high income)Europe & Central Asia (IDA & IBRD countries)European UnionFijiFinlandFragile and conflict affected situationsFranceGabonGambia, TheGeorgiaGermanyGhanaGreeceGuatemalaGuineaGuinea-BissauGuyanaHaitiHeavily indebted poor countries (HIPC)High incomeHondurasHong Kong SAR, ChinaHungaryIBRD onlyIcelandIDA & IBRD totalIDA blendIDA onlyIDA totalIndiaIndonesiaIran, Islamic Rep.IraqIrelandIsraelItalyJamaicaJapanJordanKazakhstanKenyaKiribatiKorea, Rep.KuwaitKyrgyz RepublicLao PDRLate-demographic dividendLatin America & Caribbean Latin America & Caribbean (excluding high income)Latin America & the Caribbean (IDA & IBRD countries)LatviaLeast developed countries: UN classificationLebanonLesothoLiberiaLibyaLithuaniaLow & middle incomeLow incomeLower middle incomeLuxembourgMacedonia, FYRMadagascarMalawiMalaysiaMaldivesMaliMauritaniaMauritiusMexicoMiddle East & North AfricaMiddle East & North Africa (excluding high income)Middle East & North Africa (IDA & IBRD countries)Middle incomeMoldovaMongoliaMoroccoMozambiqueMyanmarNamibiaNepalNetherlandsNew ZealandNicaraguaNigerNigeriaNorth AmericaNorwayOECD membersOmanOther small statesPacific island small statesPakistanPanamaPapua New GuineaParaguayPeruPhilippinesPolandPortugalPost-demographic dividendPre-demographic dividendQatarRomaniaRussian FederationRwandaSamoaSao Tome and PrincipeSaudi ArabiaSenegalSeychellesSierra LeoneSingaporeSlovak RepublicSloveniaSmall statesSolomon IslandsSouth AfricaSouth AsiaSouth Asia (IDA & IBRD)SpainSri LankaSt. LuciaSt. Vincent and the GrenadinesSub-Saharan Africa Sub-Saharan Africa (excluding high income)Sub-Saharan Africa (IDA & IBRD countries)SudanSurinameSwazilandSwedenSwitzerlandSyrian Arab RepublicTajikistanTanzaniaThailandTogoTongaTrinidad and TobagoTunisiaTurkeyTurkmenistanUgandaUkraineUnited Arab EmiratesUnited KingdomUnited StatesUpper middle incomeUruguayUzbekistanVanuatuVenezuela, RBVietnamWorldYemen, Rep.ZambiaZimbabwe Timeline:
This timeline shows a graph from 1971 to 2015 of Guatemala. No data until 1970. Number of actual observations by date: 45.
Source name:
World Development Indicators
Source organization:
World Bank staff estimates based on sources and methods in World Bank's "The Changing Wealth of Nations: Measuring Sustainable Development in the New Millennium" (2011).
Categories, topics:
Economy & Growth
Last updated:
apr 23, 2017
Indicators value changes by year
Minimum:
1.717 bln
jan 1, 1971
Maximum:
50.581 bln
jan 1, 2015
At the date of observation
Value
Absolute change
Change from previous value
jan 1, 1971
1.717 bln
+1.717 bln
0.0%
jan 1, 1972
1.794 bln
+77.186 mln
4.5%
jan 1, 1973
1.89 bln
+95.516 mln
5.32%
jan 1, 1974
2.3 bln
+410.618 mln
21.73%
jan 1, 1975
2.853 bln
+553.044 mln
24.04%
jan 1, 1976
3.251 bln
+397.346 mln
13.93%
jan 1, 1977
3.967 bln
+716.801 mln
22.05%
jan 1, 1978
4.964 bln
+996.846 mln
25.13%
jan 1, 1979
5.512 bln
+547.896 mln
11.04%
jan 1, 1980
6.243 bln
+730.856 mln
13.26%
jan 1, 1981
7.009 bln
+766.222 mln
12.27%
jan 1, 1982
7.669 bln
+659.906 mln
9.41%
jan 1, 1983
7.448 bln
-220.609 mln
-2.88%
jan 1, 1984
8.013 bln
+564.095 mln
7.57%
jan 1, 1985
8.412 bln
+399.364 mln
4.98%
jan 1, 1986
8.66 bln
+248.243 mln
2.95%
jan 1, 1987
6.34 bln
-2.32 bln
-26.79%
jan 1, 1988
6.26 bln
-79.991 mln
-1.26%
jan 1, 1989
6.981 bln
+721.181 mln
11.52%
jan 1, 1990
7.516 bln
+535.435 mln
7.67%
jan 1, 1991
6.618 bln
-898.54 mln
-11.95%
jan 1, 1992
8.254 bln
+1.636 bln
24.73%
jan 1, 1993
9.231 bln
+977.077 mln
11.84%
jan 1, 1994
10.182 bln
+950.208 mln
10.29%
jan 1, 1995
11.552 bln
+1.371 bln
13.46%
jan 1, 1996
12.949 bln
+1.397 bln
12.09%
jan 1, 1997
14.033 bln
+1.084 bln
8.37%
jan 1, 1998
15.781 bln
+1.749 bln
12.46%
jan 1, 1999
17.472 bln
+1.69 bln
10.71%
jan 1, 2000
16.411 bln
-1.061 bln
-6.07%
jan 1, 2001
17.251 bln
+839.657 mln
5.12%
jan 1, 2002
16.747 bln
-504.025 mln
-2.92%
jan 1, 2003
18.498 bln
+1.751 bln
10.46%
jan 1, 2004
19.486 bln
+987.955 mln
5.34%
jan 1, 2005
21.298 bln
+1.813 bln
9.3%
jan 1, 2006
24.2 bln
+2.902 bln
13.62%
jan 1, 2007
26.657 bln
+2.457 bln
10.15%
jan 1, 2008
29.895 bln
+3.238 bln
12.15%
jan 1, 2009
34.334 bln
+4.439 bln
14.85%
jan 1, 2010
32.869 bln
-1.465 bln
-4.27%
jan 1, 2011
35.266 bln
+2.397 bln
7.29%
jan 1, 2012
40.834 bln
+5.568 bln
15.79%
jan 1, 2013
44.016 bln
+3.181 bln
7.79%
jan 1, 2014
47.218 bln
+3.202 bln
7.28%
jan 1, 2015
50.581 bln
+3.363 bln
7.12%
Ranking of countries by current statistics by years


Comments: