29
/
en
AIzaSyAYiBZKx7MnpbEhh9jyipgxe19OcubqV5w
April 1, 2024
215968
Pakistan
PAK
true
2
1
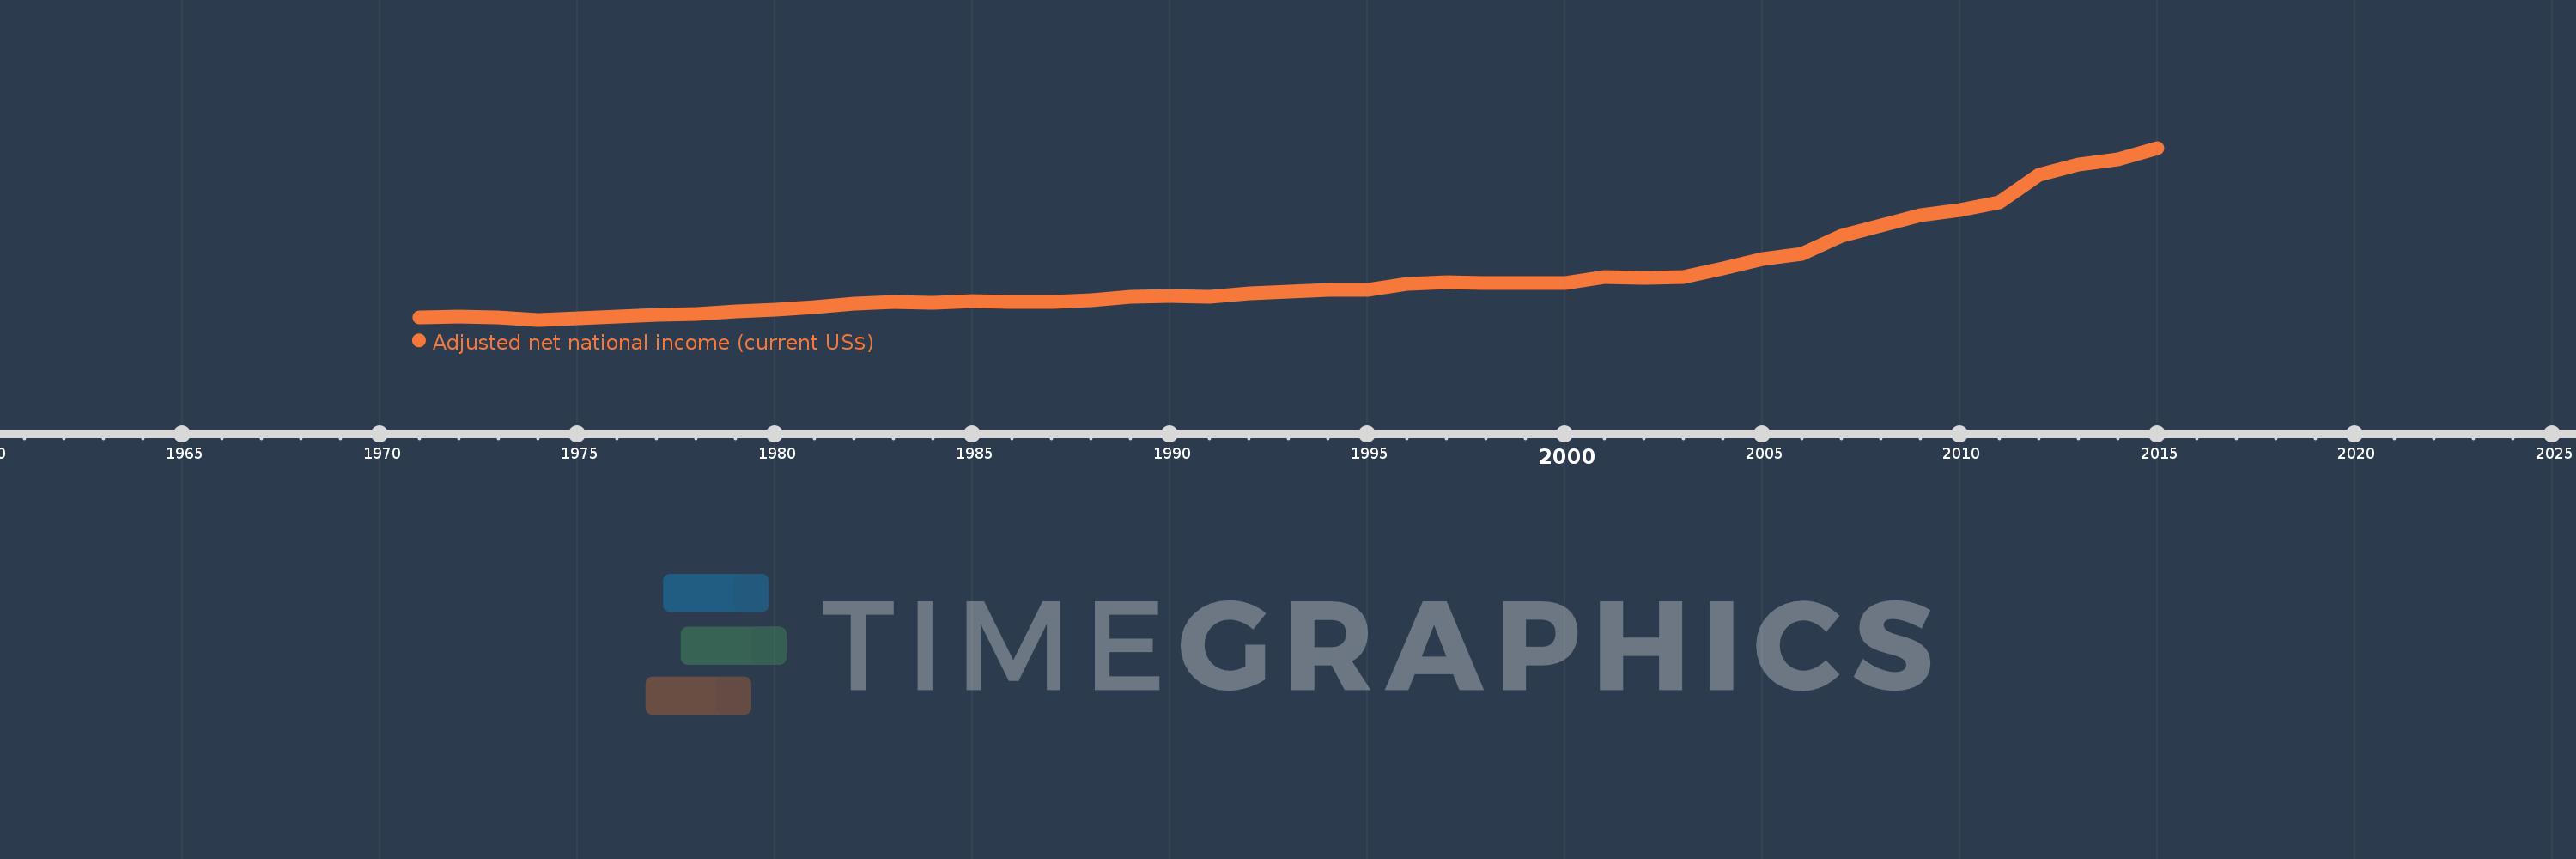
Adjusted net national income (current US$)
2015,2014,2013,2012,2011,2010,2009,2008,2007,2006,2005,2004,2003,2002,2001,2000,1999,1998,1997,1996,1995,1994,1993,1992,1991,1990,1989,1988,1987,1986,1985,1984,1983,1982,1981,1980,1979,1978,1977,1976,1975,1974,1973,1972,1971
This statistics in other country:
AfghanistanAlbaniaAlgeriaAngolaArab WorldArgentinaArmeniaAustraliaAustriaAzerbaijanBahamas, TheBahrainBangladeshBarbadosBelarusBelgiumBelizeBeninBhutanBoliviaBotswanaBrazilBrunei DarussalamBulgariaBurkina FasoBurundiCabo VerdeCambodiaCameroonCanadaCaribbean small statesCentral African RepublicCentral Europe and the BalticsChadChileChinaColombiaComorosCongo, Dem. Rep.Congo, Rep.Costa RicaCote d'IvoireCroatiaCubaCyprusCzech RepublicDenmarkDjiboutiDominicaDominican RepublicEarly-demographic dividendEast Asia & PacificEast Asia & Pacific (excluding high income)East Asia & Pacific (IDA & IBRD countries)EcuadorEgypt, Arab Rep.El SalvadorEquatorial GuineaEritreaEstoniaEthiopiaEuro areaEurope & Central AsiaEurope & Central Asia (excluding high income)Europe & Central Asia (IDA & IBRD countries)European UnionFijiFinlandFragile and conflict affected situationsFranceGabonGambia, TheGeorgiaGermanyGhanaGreeceGuatemalaGuineaGuinea-BissauGuyanaHaitiHeavily indebted poor countries (HIPC)High incomeHondurasHong Kong SAR, ChinaHungaryIBRD onlyIcelandIDA & IBRD totalIDA blendIDA onlyIDA totalIndiaIndonesiaIran, Islamic Rep.IraqIrelandIsraelItalyJamaicaJapanJordanKazakhstanKenyaKiribatiKorea, Rep.KuwaitKyrgyz RepublicLao PDRLate-demographic dividendLatin America & Caribbean Latin America & Caribbean (excluding high income)Latin America & the Caribbean (IDA & IBRD countries)LatviaLeast developed countries: UN classificationLebanonLesothoLiberiaLibyaLithuaniaLow & middle incomeLow incomeLower middle incomeLuxembourgMacedonia, FYRMadagascarMalawiMalaysiaMaldivesMaliMauritaniaMauritiusMexicoMiddle East & North AfricaMiddle East & North Africa (excluding high income)Middle East & North Africa (IDA & IBRD countries)Middle incomeMoldovaMongoliaMoroccoMozambiqueMyanmarNamibiaNepalNetherlandsNew ZealandNicaraguaNigerNigeriaNorth AmericaNorwayOECD membersOmanOther small statesPacific island small statesPakistanPanamaPapua New GuineaParaguayPeruPhilippinesPolandPortugalPost-demographic dividendPre-demographic dividendQatarRomaniaRussian FederationRwandaSamoaSao Tome and PrincipeSaudi ArabiaSenegalSeychellesSierra LeoneSingaporeSlovak RepublicSloveniaSmall statesSolomon IslandsSouth AfricaSouth AsiaSouth Asia (IDA & IBRD)SpainSri LankaSt. LuciaSt. Vincent and the GrenadinesSub-Saharan Africa Sub-Saharan Africa (excluding high income)Sub-Saharan Africa (IDA & IBRD countries)SudanSurinameSwazilandSwedenSwitzerlandSyrian Arab RepublicTajikistanTanzaniaThailandTogoTongaTrinidad and TobagoTunisiaTurkeyTurkmenistanUgandaUkraineUnited Arab EmiratesUnited KingdomUnited StatesUpper middle incomeUruguayUzbekistanVanuatuVenezuela, RBVietnamWorldYemen, Rep.ZambiaZimbabwe Timeline:
This timeline shows a graph from 1971 to 2015 of Pakistan. No data until 1970. Number of actual observations by date: 45.
Source name:
World Development Indicators
Source organization:
World Bank staff estimates based on sources and methods in World Bank's "The Changing Wealth of Nations: Measuring Sustainable Development in the New Millennium" (2011).
Categories, topics:
Economy & Growth
Last updated:
apr 23, 2017
Indicators value changes by year
Minimum:
5.859 bln
jan 1, 1974
Maximum:
238.096 bln
jan 1, 2015
At the date of observation
Value
Absolute change
Change from previous value
jan 1, 1971
8.85 bln
+8.85 bln
0.0%
jan 1, 1972
9.817 bln
+966.922 mln
10.93%
jan 1, 1973
8.524 bln
-1.293 bln
-13.17%
jan 1, 1974
5.859 bln
-2.665 bln
-31.27%
jan 1, 1975
8.127 bln
+2.268 bln
38.71%
jan 1, 1976
10.192 bln
+2.065 bln
25.41%
jan 1, 1977
12.29 bln
+2.098 bln
20.58%
jan 1, 1978
14.198 bln
+1.908 bln
15.52%
jan 1, 1979
17.45 bln
+3.252 bln
22.91%
jan 1, 1980
19.301 bln
+1.851 bln
10.61%
jan 1, 1981
23.097 bln
+3.795 bln
19.66%
jan 1, 1982
27.495 bln
+4.399 bln
19.04%
jan 1, 1983
29.836 bln
+2.341 bln
8.51%
jan 1, 1984
28.797 bln
-1.04 bln
-3.48%
jan 1, 1985
30.87 bln
+2.074 bln
7.2%
jan 1, 1986
30.452 bln
-418.077 mln
-1.35%
jan 1, 1987
29.451 bln
-1.001 bln
-3.29%
jan 1, 1988
32.053 bln
+2.602 bln
8.83%
jan 1, 1989
36.398 bln
+4.345 bln
13.56%
jan 1, 1990
37.802 bln
+1.403 bln
3.85%
jan 1, 1991
37.399 bln
-402.681 mln
-1.07%
jan 1, 1992
41.698 bln
+4.299 bln
11.49%
jan 1, 1993
43.747 bln
+2.05 bln
4.92%
jan 1, 1994
46.327 bln
+2.579 bln
5.9%
jan 1, 1995
46.579 bln
+252.349 mln
0.54%
jan 1, 1996
54.815 bln
+8.235 bln
17.68%
jan 1, 1997
56.144 bln
+1.33 bln
2.43%
jan 1, 1998
55.089 bln
-1.056 bln
-1.88%
jan 1, 1999
54.89 bln
-198.654 mln
-0.36%
jan 1, 2000
55.684 bln
+794.271 mln
1.45%
jan 1, 2001
63.926 bln
+8.242 bln
14.8%
jan 1, 2002
62.512 bln
-1.415 bln
-2.21%
jan 1, 2003
63.981 bln
+1.47 bln
2.35%
jan 1, 2004
74.839 bln
+10.857 bln
16.97%
jan 1, 2005
87.555 bln
+12.716 bln
16.99%
jan 1, 2006
95.256 bln
+7.702 bln
8.8%
jan 1, 2007
119.868 bln
+24.612 bln
25.84%
jan 1, 2008
133.281 bln
+13.413 bln
11.19%
jan 1, 2009
147.217 bln
+13.936 bln
10.46%
jan 1, 2010
154.447 bln
+7.23 bln
4.91%
jan 1, 2011
164.698 bln
+10.251 bln
6.64%
jan 1, 2012
202.241 bln
+37.543 bln
22.8%
jan 1, 2013
215.389 bln
+13.148 bln
6.5%
jan 1, 2014
222.751 bln
+7.361 bln
3.42%
jan 1, 2015
238.096 bln
+15.346 bln
6.89%
Ranking of countries by current statistics by years


Comments: