29
/
en
AIzaSyAYiBZKx7MnpbEhh9jyipgxe19OcubqV5w
April 1, 2024
52367
OECD members
OED
false
2
1
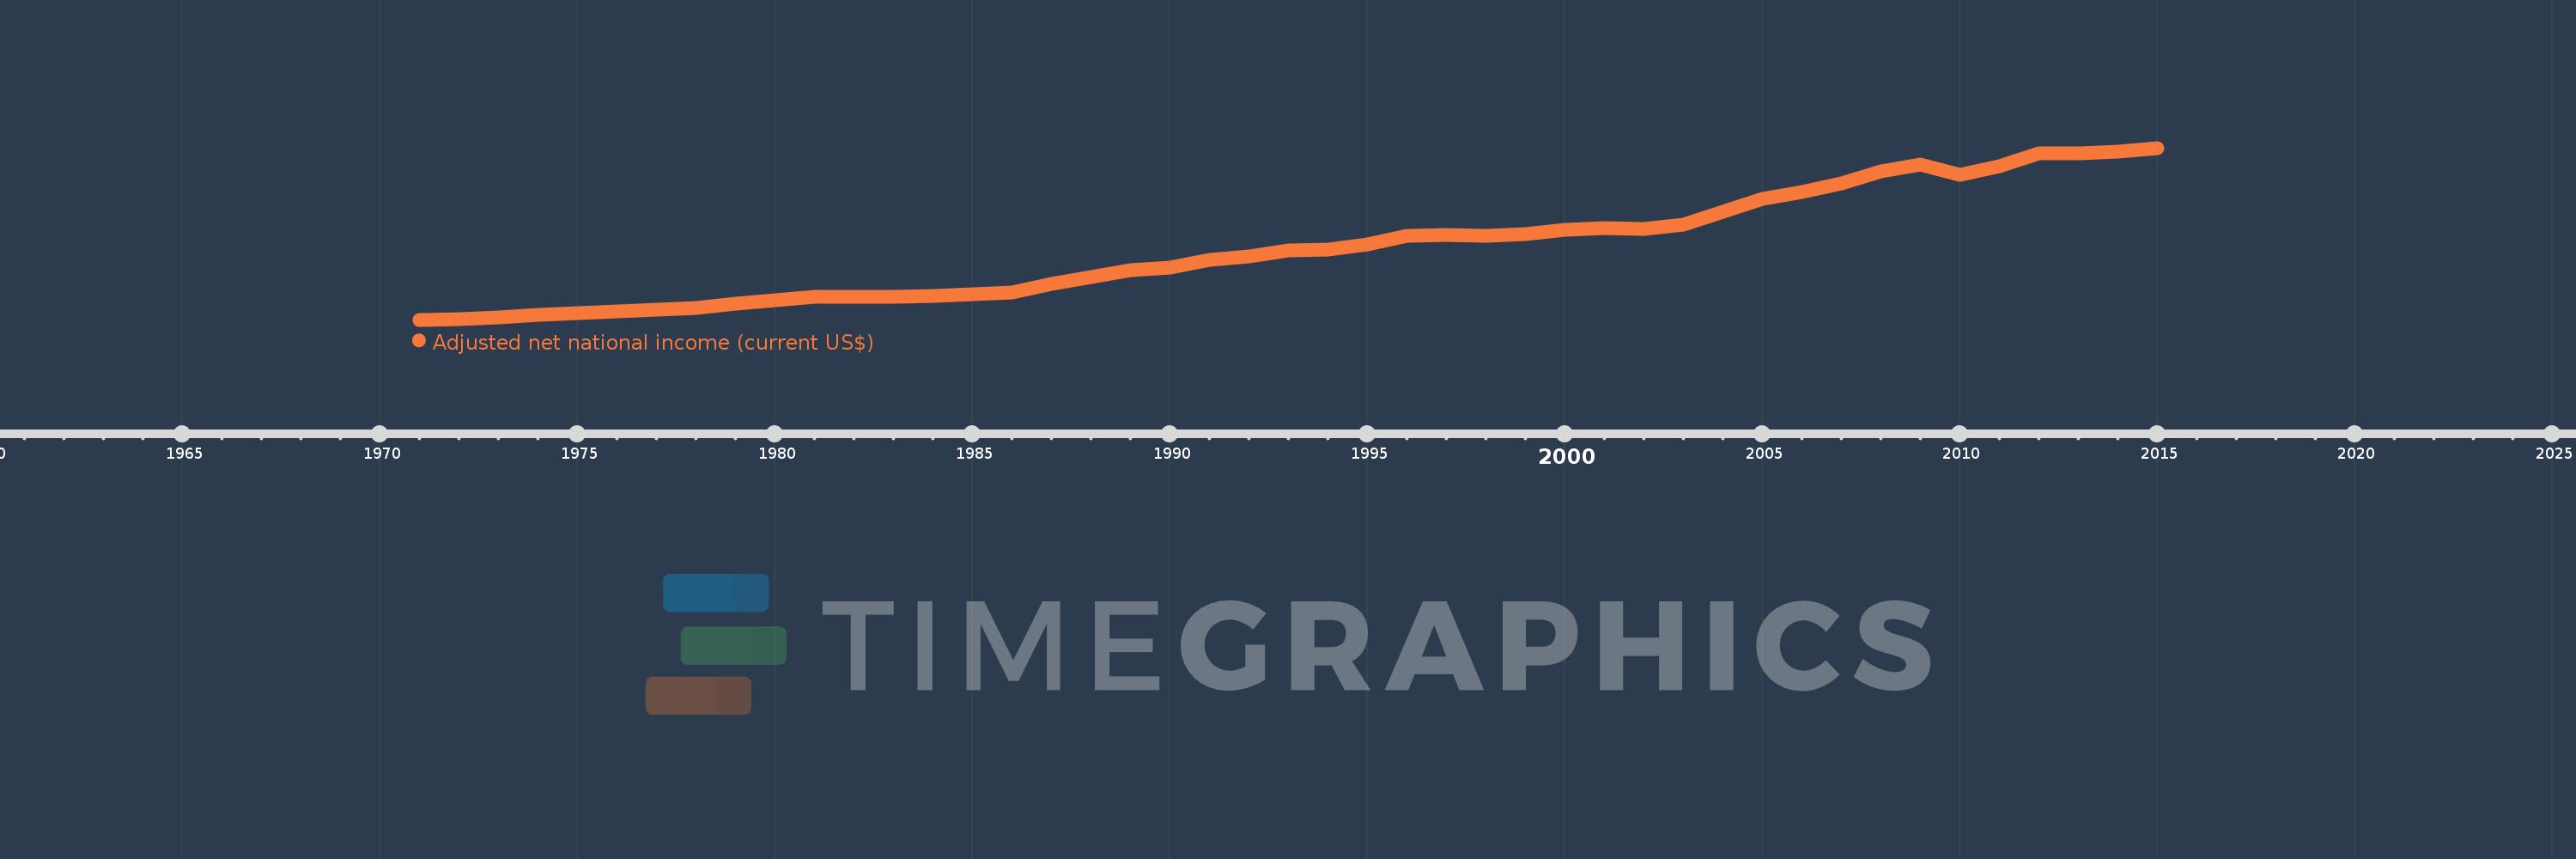
Adjusted net national income (current US$)
2015,2014,2013,2012,2011,2010,2009,2008,2007,2006,2005,2004,2003,2002,2001,2000,1999,1998,1997,1996,1995,1994,1993,1992,1991,1990,1989,1988,1987,1986,1985,1984,1983,1982,1981,1980,1979,1978,1977,1976,1975,1974,1973,1972,1971
This statistics in other country:
AfghanistanAlbaniaAlgeriaAngolaArab WorldArgentinaArmeniaAustraliaAustriaAzerbaijanBahamas, TheBahrainBangladeshBarbadosBelarusBelgiumBelizeBeninBhutanBoliviaBotswanaBrazilBrunei DarussalamBulgariaBurkina FasoBurundiCabo VerdeCambodiaCameroonCanadaCaribbean small statesCentral African RepublicCentral Europe and the BalticsChadChileChinaColombiaComorosCongo, Dem. Rep.Congo, Rep.Costa RicaCote d'IvoireCroatiaCubaCyprusCzech RepublicDenmarkDjiboutiDominicaDominican RepublicEarly-demographic dividendEast Asia & PacificEast Asia & Pacific (excluding high income)East Asia & Pacific (IDA & IBRD countries)EcuadorEgypt, Arab Rep.El SalvadorEquatorial GuineaEritreaEstoniaEthiopiaEuro areaEurope & Central AsiaEurope & Central Asia (excluding high income)Europe & Central Asia (IDA & IBRD countries)European UnionFijiFinlandFragile and conflict affected situationsFranceGabonGambia, TheGeorgiaGermanyGhanaGreeceGuatemalaGuineaGuinea-BissauGuyanaHaitiHeavily indebted poor countries (HIPC)High incomeHondurasHong Kong SAR, ChinaHungaryIBRD onlyIcelandIDA & IBRD totalIDA blendIDA onlyIDA totalIndiaIndonesiaIran, Islamic Rep.IraqIrelandIsraelItalyJamaicaJapanJordanKazakhstanKenyaKiribatiKorea, Rep.KuwaitKyrgyz RepublicLao PDRLate-demographic dividendLatin America & Caribbean Latin America & Caribbean (excluding high income)Latin America & the Caribbean (IDA & IBRD countries)LatviaLeast developed countries: UN classificationLebanonLesothoLiberiaLibyaLithuaniaLow & middle incomeLow incomeLower middle incomeLuxembourgMacedonia, FYRMadagascarMalawiMalaysiaMaldivesMaliMauritaniaMauritiusMexicoMiddle East & North AfricaMiddle East & North Africa (excluding high income)Middle East & North Africa (IDA & IBRD countries)Middle incomeMoldovaMongoliaMoroccoMozambiqueMyanmarNamibiaNepalNetherlandsNew ZealandNicaraguaNigerNigeriaNorth AmericaNorwayOECD membersOmanOther small statesPacific island small statesPakistanPanamaPapua New GuineaParaguayPeruPhilippinesPolandPortugalPost-demographic dividendPre-demographic dividendQatarRomaniaRussian FederationRwandaSamoaSao Tome and PrincipeSaudi ArabiaSenegalSeychellesSierra LeoneSingaporeSlovak RepublicSloveniaSmall statesSolomon IslandsSouth AfricaSouth AsiaSouth Asia (IDA & IBRD)SpainSri LankaSt. LuciaSt. Vincent and the GrenadinesSub-Saharan Africa Sub-Saharan Africa (excluding high income)Sub-Saharan Africa (IDA & IBRD countries)SudanSurinameSwazilandSwedenSwitzerlandSyrian Arab RepublicTajikistanTanzaniaThailandTogoTongaTrinidad and TobagoTunisiaTurkeyTurkmenistanUgandaUkraineUnited Arab EmiratesUnited KingdomUnited StatesUpper middle incomeUruguayUzbekistanVanuatuVenezuela, RBVietnamWorldYemen, Rep.ZambiaZimbabwe Timeline:
This timeline shows a graph from 1971 to 2015 of OECD members. No data until 1970. Number of actual observations by date: 45.
Source name:
World Development Indicators
Source organization:
World Bank staff estimates based on sources and methods in World Bank's "The Changing Wealth of Nations: Measuring Sustainable Development in the New Millennium" (2011).
Categories, topics:
Economy & Growth
Last updated:
apr 23, 2017
Indicators value changes by year
Minimum:
2.068 trl
jan 1, 1971
Maximum:
40.82 trl
jan 1, 2015
At the date of observation
Value
Absolute change
Change from previous value
jan 1, 1971
2.068 trl
+2.068 trl
0.0%
jan 1, 1972
2.282 trl
+213.851 bln
10.34%
jan 1, 1973
2.65 trl
+367.411 bln
16.1%
jan 1, 1974
3.198 trl
+548.443 bln
20.7%
jan 1, 1975
3.517 trl
+319.464 bln
9.99%
jan 1, 1976
3.926 trl
+408.812 bln
11.62%
jan 1, 1977
4.258 trl
+332.073 bln
8.46%
jan 1, 1978
4.794 trl
+535.742 bln
12.58%
jan 1, 1979
5.759 trl
+965.287 bln
20.13%
jan 1, 1980
6.543 trl
+784.059 bln
13.61%
jan 1, 1981
7.197 trl
+653.949 bln
9.99%
jan 1, 1982
7.309 trl
+111.586 bln
1.55%
jan 1, 1983
7.2 trl
-108.82 bln
-1.49%
jan 1, 1984
7.454 trl
+253.931 bln
3.53%
jan 1, 1985
7.86 trl
+405.895 bln
5.45%
jan 1, 1986
8.295 trl
+435.334 bln
5.54%
jan 1, 1987
10.096 trl
+1.801 trl
21.71%
jan 1, 1988
11.714 trl
+1.617 trl
16.02%
jan 1, 1989
13.299 trl
+1.585 trl
13.53%
jan 1, 1990
13.853 trl
+554.196 bln
4.17%
jan 1, 1991
15.526 trl
+1.673 trl
12.08%
jan 1, 1992
16.385 trl
+858.479 bln
5.53%
jan 1, 1993
17.611 trl
+1.226 trl
7.49%
jan 1, 1994
17.812 trl
+201.491 bln
1.14%
jan 1, 1995
19.044 trl
+1.232 trl
6.92%
jan 1, 1996
20.911 trl
+1.867 trl
9.8%
jan 1, 1997
21.165 trl
+254.375 bln
1.22%
jan 1, 1998
20.98 trl
-185.595 bln
-0.88%
jan 1, 1999
21.291 trl
+311.0 bln
1.48%
jan 1, 2000
22.332 trl
+1.041 trl
4.89%
jan 1, 2001
22.773 trl
+441.15 bln
1.98%
jan 1, 2002
22.588 trl
-185.228 bln
-0.81%
jan 1, 2003
23.535 trl
+946.799 bln
4.19%
jan 1, 2004
26.329 trl
+2.794 trl
11.87%
jan 1, 2005
29.365 trl
+3.036 trl
11.53%
jan 1, 2006
30.946 trl
+1.581 trl
5.38%
jan 1, 2007
32.729 trl
+1.782 trl
5.76%
jan 1, 2008
35.518 trl
+2.789 trl
8.52%
jan 1, 2009
37.054 trl
+1.536 trl
4.33%
jan 1, 2010
34.79 trl
-2.264 trl
-6.11%
jan 1, 2011
36.767 trl
+1.976 trl
5.68%
jan 1, 2012
39.524 trl
+2.758 trl
7.5%
jan 1, 2013
39.625 trl
+100.738 bln
0.25%
jan 1, 2014
40.009 trl
+383.714 bln
0.97%
jan 1, 2015
40.82 trl
+810.744 bln
2.03%
Ranking of countries by current statistics by years


Comments: