29
/
en
AIzaSyAYiBZKx7MnpbEhh9jyipgxe19OcubqV5w
April 1, 2024
276326
United States
USA
true
2
1
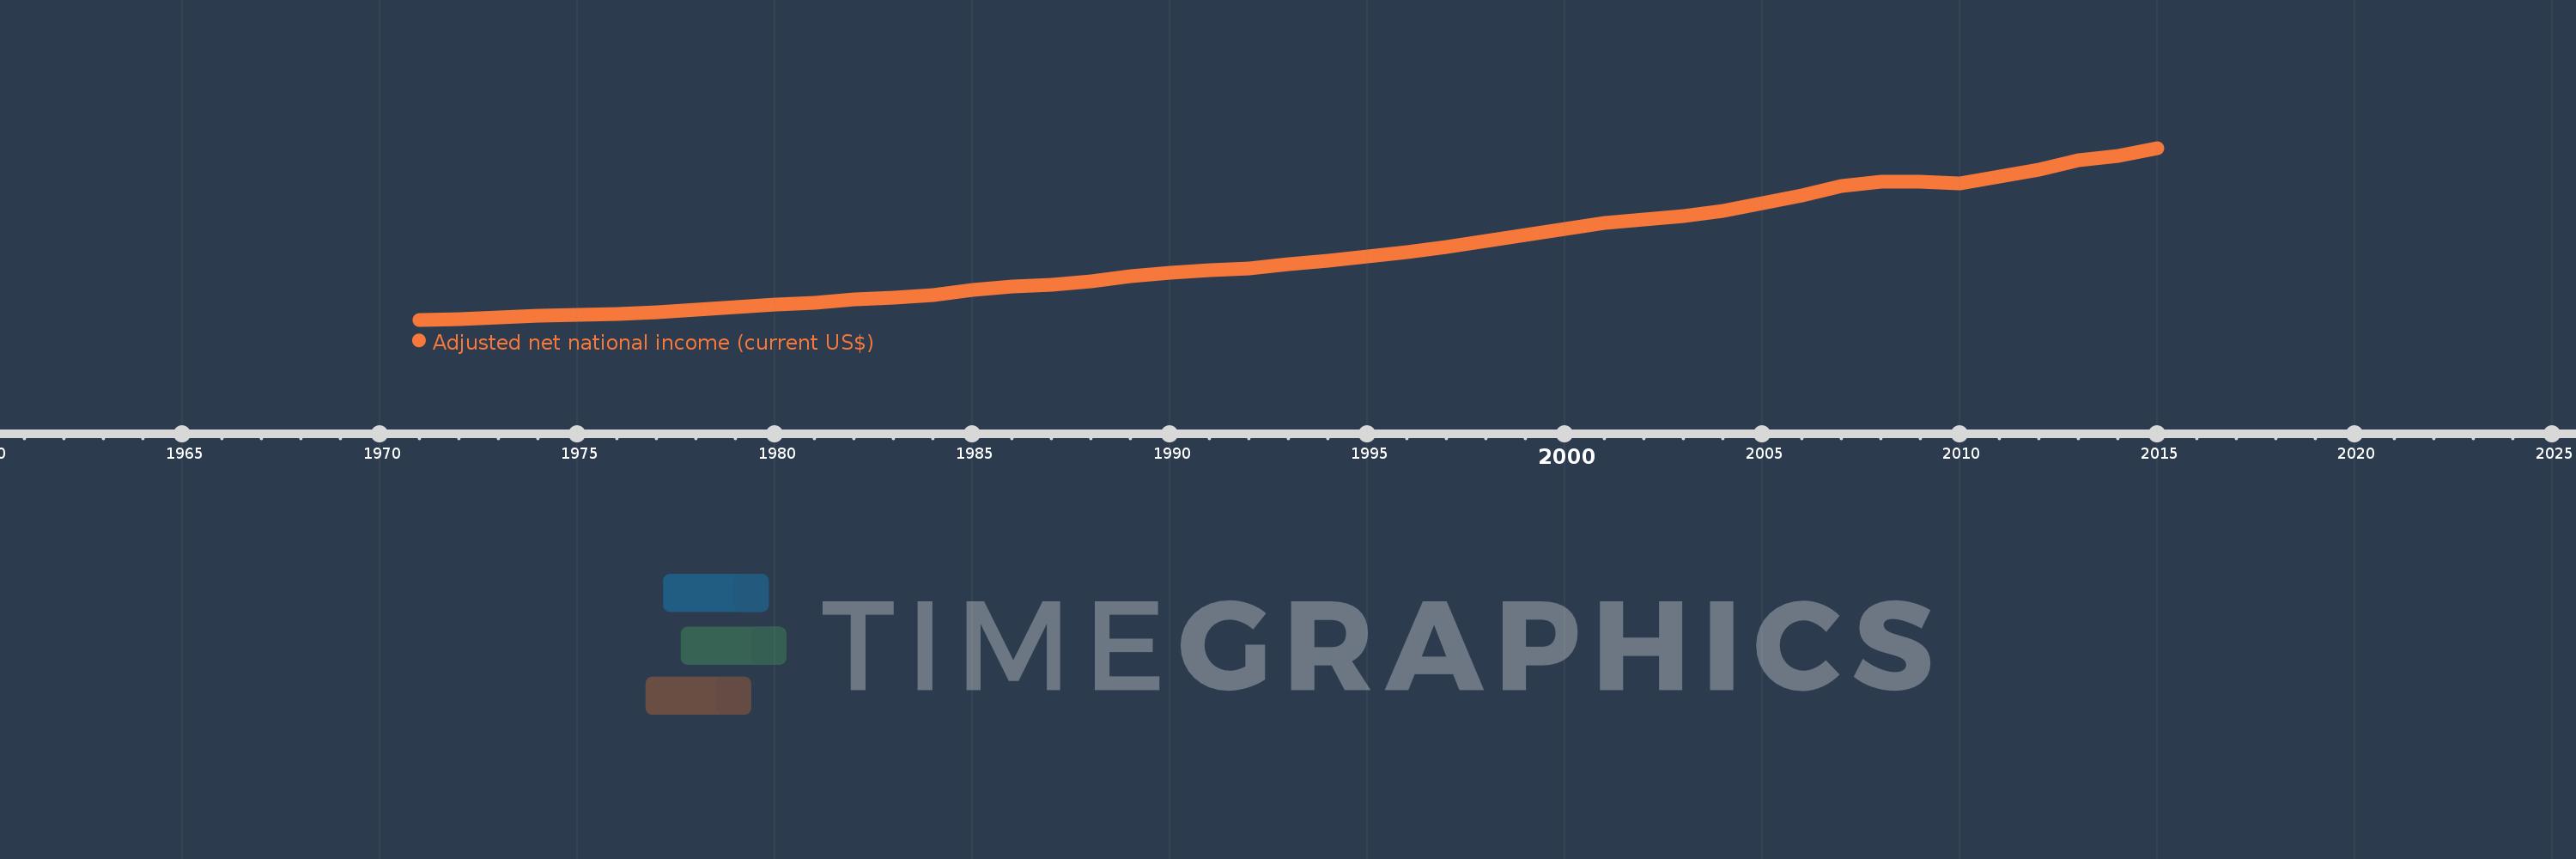
Adjusted net national income (current US$)
2015,2014,2013,2012,2011,2010,2009,2008,2007,2006,2005,2004,2003,2002,2001,2000,1999,1998,1997,1996,1995,1994,1993,1992,1991,1990,1989,1988,1987,1986,1985,1984,1983,1982,1981,1980,1979,1978,1977,1976,1975,1974,1973,1972,1971
This statistics in other country:
AfghanistanAlbaniaAlgeriaAngolaArab WorldArgentinaArmeniaAustraliaAustriaAzerbaijanBahamas, TheBahrainBangladeshBarbadosBelarusBelgiumBelizeBeninBhutanBoliviaBotswanaBrazilBrunei DarussalamBulgariaBurkina FasoBurundiCabo VerdeCambodiaCameroonCanadaCaribbean small statesCentral African RepublicCentral Europe and the BalticsChadChileChinaColombiaComorosCongo, Dem. Rep.Congo, Rep.Costa RicaCote d'IvoireCroatiaCubaCyprusCzech RepublicDenmarkDjiboutiDominicaDominican RepublicEarly-demographic dividendEast Asia & PacificEast Asia & Pacific (excluding high income)East Asia & Pacific (IDA & IBRD countries)EcuadorEgypt, Arab Rep.El SalvadorEquatorial GuineaEritreaEstoniaEthiopiaEuro areaEurope & Central AsiaEurope & Central Asia (excluding high income)Europe & Central Asia (IDA & IBRD countries)European UnionFijiFinlandFragile and conflict affected situationsFranceGabonGambia, TheGeorgiaGermanyGhanaGreeceGuatemalaGuineaGuinea-BissauGuyanaHaitiHeavily indebted poor countries (HIPC)High incomeHondurasHong Kong SAR, ChinaHungaryIBRD onlyIcelandIDA & IBRD totalIDA blendIDA onlyIDA totalIndiaIndonesiaIran, Islamic Rep.IraqIrelandIsraelItalyJamaicaJapanJordanKazakhstanKenyaKiribatiKorea, Rep.KuwaitKyrgyz RepublicLao PDRLate-demographic dividendLatin America & Caribbean Latin America & Caribbean (excluding high income)Latin America & the Caribbean (IDA & IBRD countries)LatviaLeast developed countries: UN classificationLebanonLesothoLiberiaLibyaLithuaniaLow & middle incomeLow incomeLower middle incomeLuxembourgMacedonia, FYRMadagascarMalawiMalaysiaMaldivesMaliMauritaniaMauritiusMexicoMiddle East & North AfricaMiddle East & North Africa (excluding high income)Middle East & North Africa (IDA & IBRD countries)Middle incomeMoldovaMongoliaMoroccoMozambiqueMyanmarNamibiaNepalNetherlandsNew ZealandNicaraguaNigerNigeriaNorth AmericaNorwayOECD membersOmanOther small statesPacific island small statesPakistanPanamaPapua New GuineaParaguayPeruPhilippinesPolandPortugalPost-demographic dividendPre-demographic dividendQatarRomaniaRussian FederationRwandaSamoaSao Tome and PrincipeSaudi ArabiaSenegalSeychellesSierra LeoneSingaporeSlovak RepublicSloveniaSmall statesSolomon IslandsSouth AfricaSouth AsiaSouth Asia (IDA & IBRD)SpainSri LankaSt. LuciaSt. Vincent and the GrenadinesSub-Saharan Africa Sub-Saharan Africa (excluding high income)Sub-Saharan Africa (IDA & IBRD countries)SudanSurinameSwazilandSwedenSwitzerlandSyrian Arab RepublicTajikistanTanzaniaThailandTogoTongaTrinidad and TobagoTunisiaTurkeyTurkmenistanUgandaUkraineUnited Arab EmiratesUnited KingdomUnited StatesUpper middle incomeUruguayUzbekistanVanuatuVenezuela, RBVietnamWorldYemen, Rep.ZambiaZimbabwe Timeline:
This timeline shows a graph from 1971 to 2015 of United States. No data until 1970. Number of actual observations by date: 45.
Source name:
World Development Indicators
Source organization:
World Bank staff estimates based on sources and methods in World Bank's "The Changing Wealth of Nations: Measuring Sustainable Development in the New Millennium" (2011).
Categories, topics:
Economy & Growth
Last updated:
apr 23, 2017
Indicators value changes by year
Minimum:
931.502 bln
jan 1, 1971
Maximum:
14.941 trl
jan 1, 2015
At the date of observation
Value
Absolute change
Change from previous value
jan 1, 1971
931.502 bln
+931.502 bln
0.0%
jan 1, 1972
1.007 trl
+75.527 bln
8.11%
jan 1, 1973
1.113 trl
+105.68 bln
10.49%
jan 1, 1974
1.242 trl
+129.329 bln
11.62%
jan 1, 1975
1.306 trl
+63.919 bln
5.15%
jan 1, 1976
1.41 trl
+104.029 bln
7.97%
jan 1, 1977
1.57 trl
+160.399 bln
11.38%
jan 1, 1978
1.75 trl
+179.822 bln
11.45%
jan 1, 1979
1.976 trl
+225.492 bln
12.88%
jan 1, 1980
2.138 trl
+162.389 bln
8.22%
jan 1, 1981
2.3 trl
+161.507 bln
7.55%
jan 1, 1982
2.6 trl
+300.302 bln
13.06%
jan 1, 1983
2.733 trl
+133.501 bln
5.13%
jan 1, 1984
2.974 trl
+240.737 bln
8.81%
jan 1, 1985
3.359 trl
+385.009 bln
12.95%
jan 1, 1986
3.611 trl
+251.997 bln
7.5%
jan 1, 1987
3.814 trl
+203.142 bln
5.63%
jan 1, 1988
4.081 trl
+266.804 bln
6.99%
jan 1, 1989
4.464 trl
+382.659 bln
9.38%
jan 1, 1990
4.751 trl
+286.802 bln
6.43%
jan 1, 1991
4.987 trl
+236.101 bln
4.97%
jan 1, 1992
5.145 trl
+158.471 bln
3.18%
jan 1, 1993
5.464 trl
+319.094 bln
6.2%
jan 1, 1994
5.719 trl
+255.182 bln
4.67%
jan 1, 1995
6.108 trl
+389.019 bln
6.8%
jan 1, 1996
6.445 trl
+336.238 bln
5.5%
jan 1, 1997
6.85 trl
+405.509 bln
6.29%
jan 1, 1998
7.336 trl
+486.295 bln
7.1%
jan 1, 1999
7.836 trl
+500.007 bln
6.82%
jan 1, 2000
8.305 trl
+468.243 bln
5.98%
jan 1, 2001
8.836 trl
+531.225 bln
6.4%
jan 1, 2002
9.125 trl
+289.211 bln
3.27%
jan 1, 2003
9.393 trl
+268.061 bln
2.94%
jan 1, 2004
9.791 trl
+397.533 bln
4.23%
jan 1, 2005
10.447 trl
+656.581 bln
6.71%
jan 1, 2006
11.099 trl
+651.329 bln
6.23%
jan 1, 2007
11.852 trl
+753.794 bln
6.79%
jan 1, 2008
12.16 trl
+307.076 bln
2.59%
jan 1, 2009
12.17 trl
+10.322 bln
0.08%
jan 1, 2010
12.031 trl
-139.013 bln
-1.14%
jan 1, 2011
12.62 trl
+589.635 bln
4.9%
jan 1, 2012
13.193 trl
+572.476 bln
4.54%
jan 1, 2013
13.914 trl
+721.387 bln
5.47%
jan 1, 2014
14.296 trl
+382.124 bln
2.75%
jan 1, 2015
14.941 trl
+644.604 bln
4.51%
Ranking of countries by current statistics by years


Comments: