29
/
en
AIzaSyAYiBZKx7MnpbEhh9jyipgxe19OcubqV5w
April 1, 2024
281857
Vietnam
VNM
true
2
1
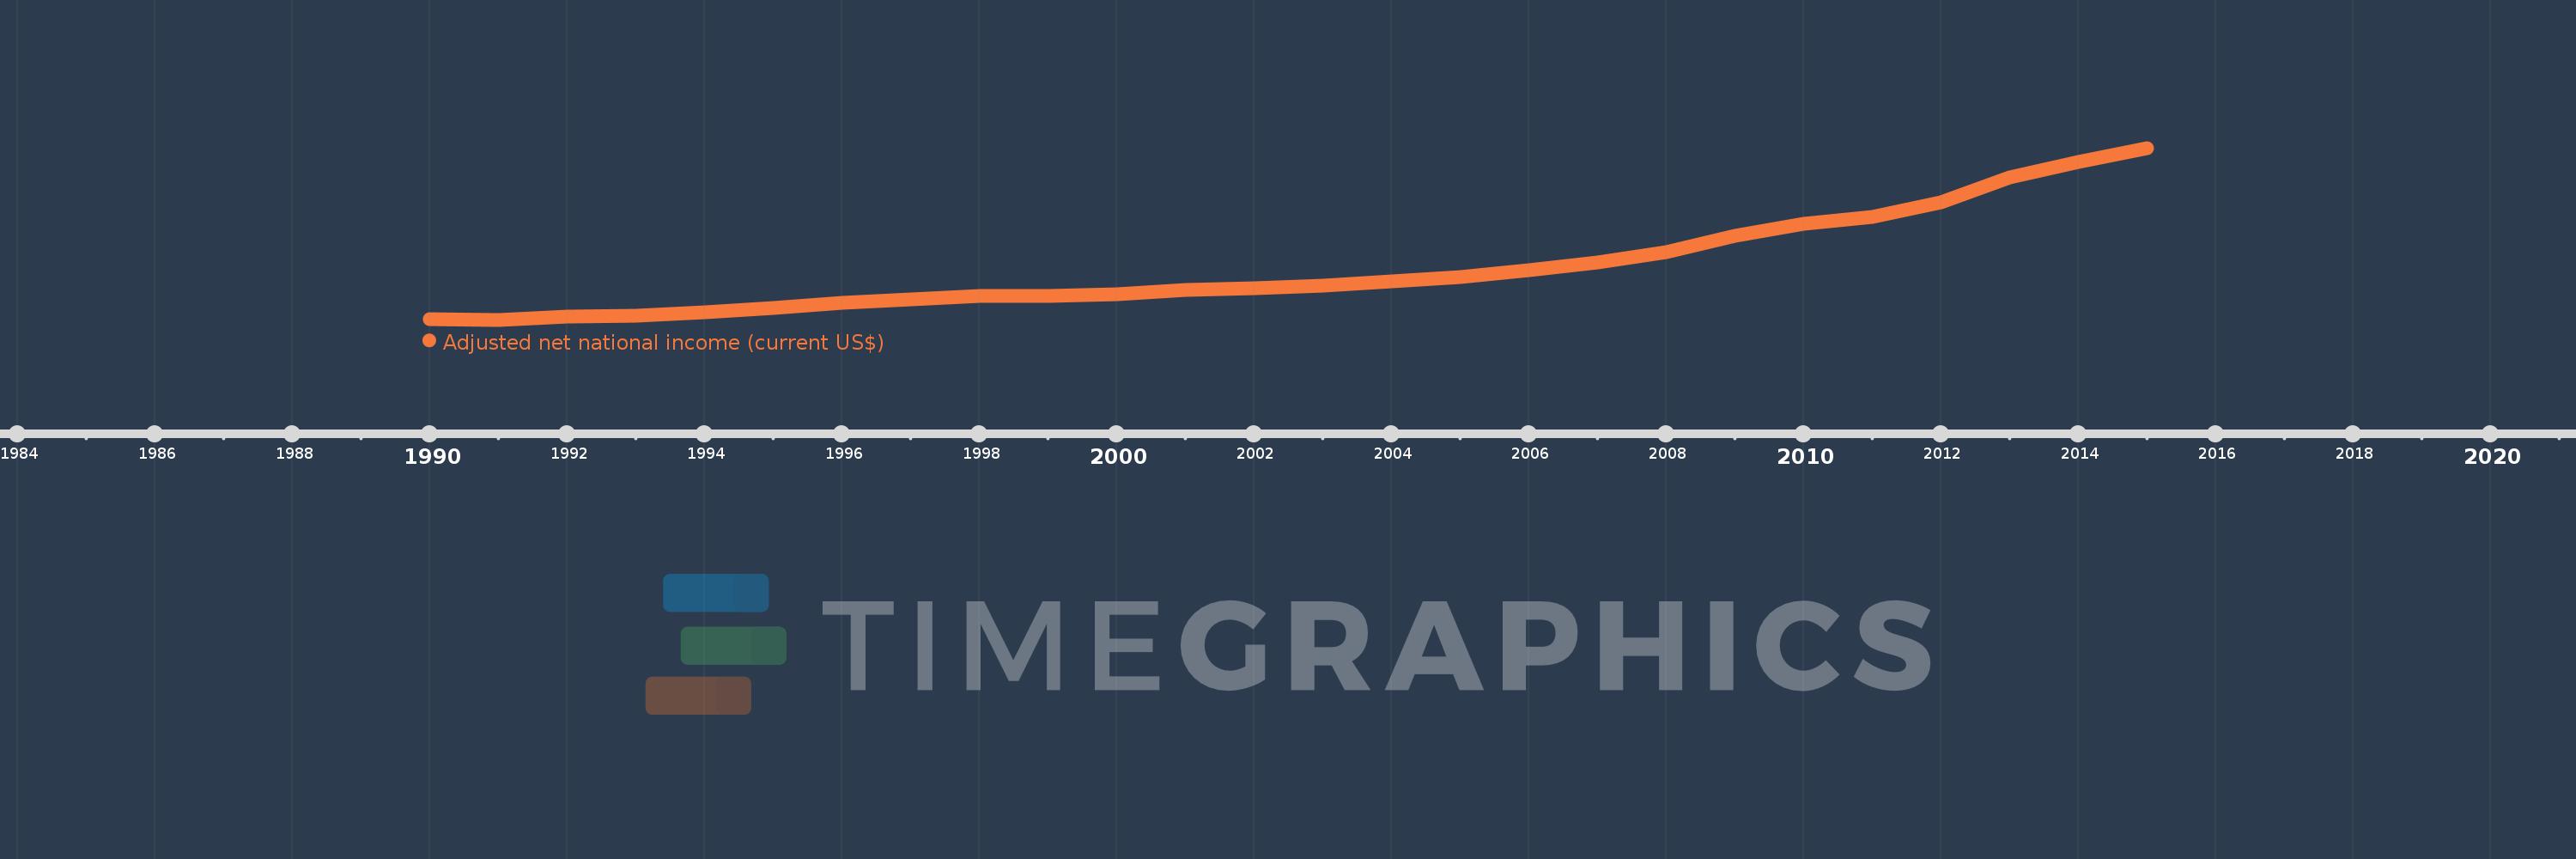
Adjusted net national income (current US$)
2015,2014,2013,2012,2011,2010,2009,2008,2007,2006,2005,2004,2003,2002,2001,2000,1999,1998,1997,1996,1995,1994,1993,1992,1991,1990
This statistics in other country:
AfghanistanAlbaniaAlgeriaAngolaArab WorldArgentinaArmeniaAustraliaAustriaAzerbaijanBahamas, TheBahrainBangladeshBarbadosBelarusBelgiumBelizeBeninBhutanBoliviaBotswanaBrazilBrunei DarussalamBulgariaBurkina FasoBurundiCabo VerdeCambodiaCameroonCanadaCaribbean small statesCentral African RepublicCentral Europe and the BalticsChadChileChinaColombiaComorosCongo, Dem. Rep.Congo, Rep.Costa RicaCote d'IvoireCroatiaCubaCyprusCzech RepublicDenmarkDjiboutiDominicaDominican RepublicEarly-demographic dividendEast Asia & PacificEast Asia & Pacific (excluding high income)East Asia & Pacific (IDA & IBRD countries)EcuadorEgypt, Arab Rep.El SalvadorEquatorial GuineaEritreaEstoniaEthiopiaEuro areaEurope & Central AsiaEurope & Central Asia (excluding high income)Europe & Central Asia (IDA & IBRD countries)European UnionFijiFinlandFragile and conflict affected situationsFranceGabonGambia, TheGeorgiaGermanyGhanaGreeceGuatemalaGuineaGuinea-BissauGuyanaHaitiHeavily indebted poor countries (HIPC)High incomeHondurasHong Kong SAR, ChinaHungaryIBRD onlyIcelandIDA & IBRD totalIDA blendIDA onlyIDA totalIndiaIndonesiaIran, Islamic Rep.IraqIrelandIsraelItalyJamaicaJapanJordanKazakhstanKenyaKiribatiKorea, Rep.KuwaitKyrgyz RepublicLao PDRLate-demographic dividendLatin America & Caribbean Latin America & Caribbean (excluding high income)Latin America & the Caribbean (IDA & IBRD countries)LatviaLeast developed countries: UN classificationLebanonLesothoLiberiaLibyaLithuaniaLow & middle incomeLow incomeLower middle incomeLuxembourgMacedonia, FYRMadagascarMalawiMalaysiaMaldivesMaliMauritaniaMauritiusMexicoMiddle East & North AfricaMiddle East & North Africa (excluding high income)Middle East & North Africa (IDA & IBRD countries)Middle incomeMoldovaMongoliaMoroccoMozambiqueMyanmarNamibiaNepalNetherlandsNew ZealandNicaraguaNigerNigeriaNorth AmericaNorwayOECD membersOmanOther small statesPacific island small statesPakistanPanamaPapua New GuineaParaguayPeruPhilippinesPolandPortugalPost-demographic dividendPre-demographic dividendQatarRomaniaRussian FederationRwandaSamoaSao Tome and PrincipeSaudi ArabiaSenegalSeychellesSierra LeoneSingaporeSlovak RepublicSloveniaSmall statesSolomon IslandsSouth AfricaSouth AsiaSouth Asia (IDA & IBRD)SpainSri LankaSt. LuciaSt. Vincent and the GrenadinesSub-Saharan Africa Sub-Saharan Africa (excluding high income)Sub-Saharan Africa (IDA & IBRD countries)SudanSurinameSwazilandSwedenSwitzerlandSyrian Arab RepublicTajikistanTanzaniaThailandTogoTongaTrinidad and TobagoTunisiaTurkeyTurkmenistanUgandaUkraineUnited Arab EmiratesUnited KingdomUnited StatesUpper middle incomeUruguayUzbekistanVanuatuVenezuela, RBVietnamWorldYemen, Rep.ZambiaZimbabwe Timeline:
This timeline shows a graph from 1990 to 2015 of Vietnam. No data until 1989. Number of actual observations by date: 26.
Source name:
World Development Indicators
Source organization:
World Bank staff estimates based on sources and methods in World Bank's "The Changing Wealth of Nations: Measuring Sustainable Development in the New Millennium" (2011).
Categories, topics:
Economy & Growth
Last updated:
apr 23, 2017
Indicators value changes by year
Minimum:
5.153 bln
jan 1, 1991
Maximum:
140.419 bln
jan 1, 2015
At the date of observation
Value
Absolute change
Change from previous value
jan 1, 1990
5.729 bln
+5.729 bln
0.0%
jan 1, 1991
5.153 bln
-576.307 mln
-10.06%
jan 1, 1992
7.901 bln
+2.748 bln
53.32%
jan 1, 1993
8.162 bln
+261.413 mln
3.31%
jan 1, 1994
11.259 bln
+3.097 bln
37.95%
jan 1, 1995
14.192 bln
+2.933 bln
26.05%
jan 1, 1996
18.197 bln
+4.004 bln
28.21%
jan 1, 1997
21.471 bln
+3.274 bln
17.99%
jan 1, 1998
23.573 bln
+2.102 bln
9.79%
jan 1, 1999
24.121 bln
+548.262 mln
2.33%
jan 1, 2000
25.193 bln
+1.072 bln
4.44%
jan 1, 2001
28.399 bln
+3.206 bln
12.72%
jan 1, 2002
29.872 bln
+1.473 bln
5.19%
jan 1, 2003
32.098 bln
+2.226 bln
7.45%
jan 1, 2004
35.486 bln
+3.387 bln
10.55%
jan 1, 2005
38.867 bln
+3.381 bln
9.53%
jan 1, 2006
44.0 bln
+5.133 bln
13.21%
jan 1, 2007
50.036 bln
+6.037 bln
13.72%
jan 1, 2008
58.581 bln
+8.545 bln
17.08%
jan 1, 2009
71.32 bln
+12.739 bln
21.75%
jan 1, 2010
80.702 bln
+9.381 bln
13.15%
jan 1, 2011
86.208 bln
+5.507 bln
6.82%
jan 1, 2012
97.309 bln
+11.101 bln
12.88%
jan 1, 2013
117.473 bln
+20.164 bln
20.72%
jan 1, 2014
129.377 bln
+11.904 bln
10.13%
jan 1, 2015
140.419 bln
+11.041 bln
8.53%
Ranking of countries by current statistics by years


Comments: