29
/
en
AIzaSyAYiBZKx7MnpbEhh9jyipgxe19OcubqV5w
April 1, 2024
27822
East Asia & Pacific (excluding high income)
EAP
false
2
1
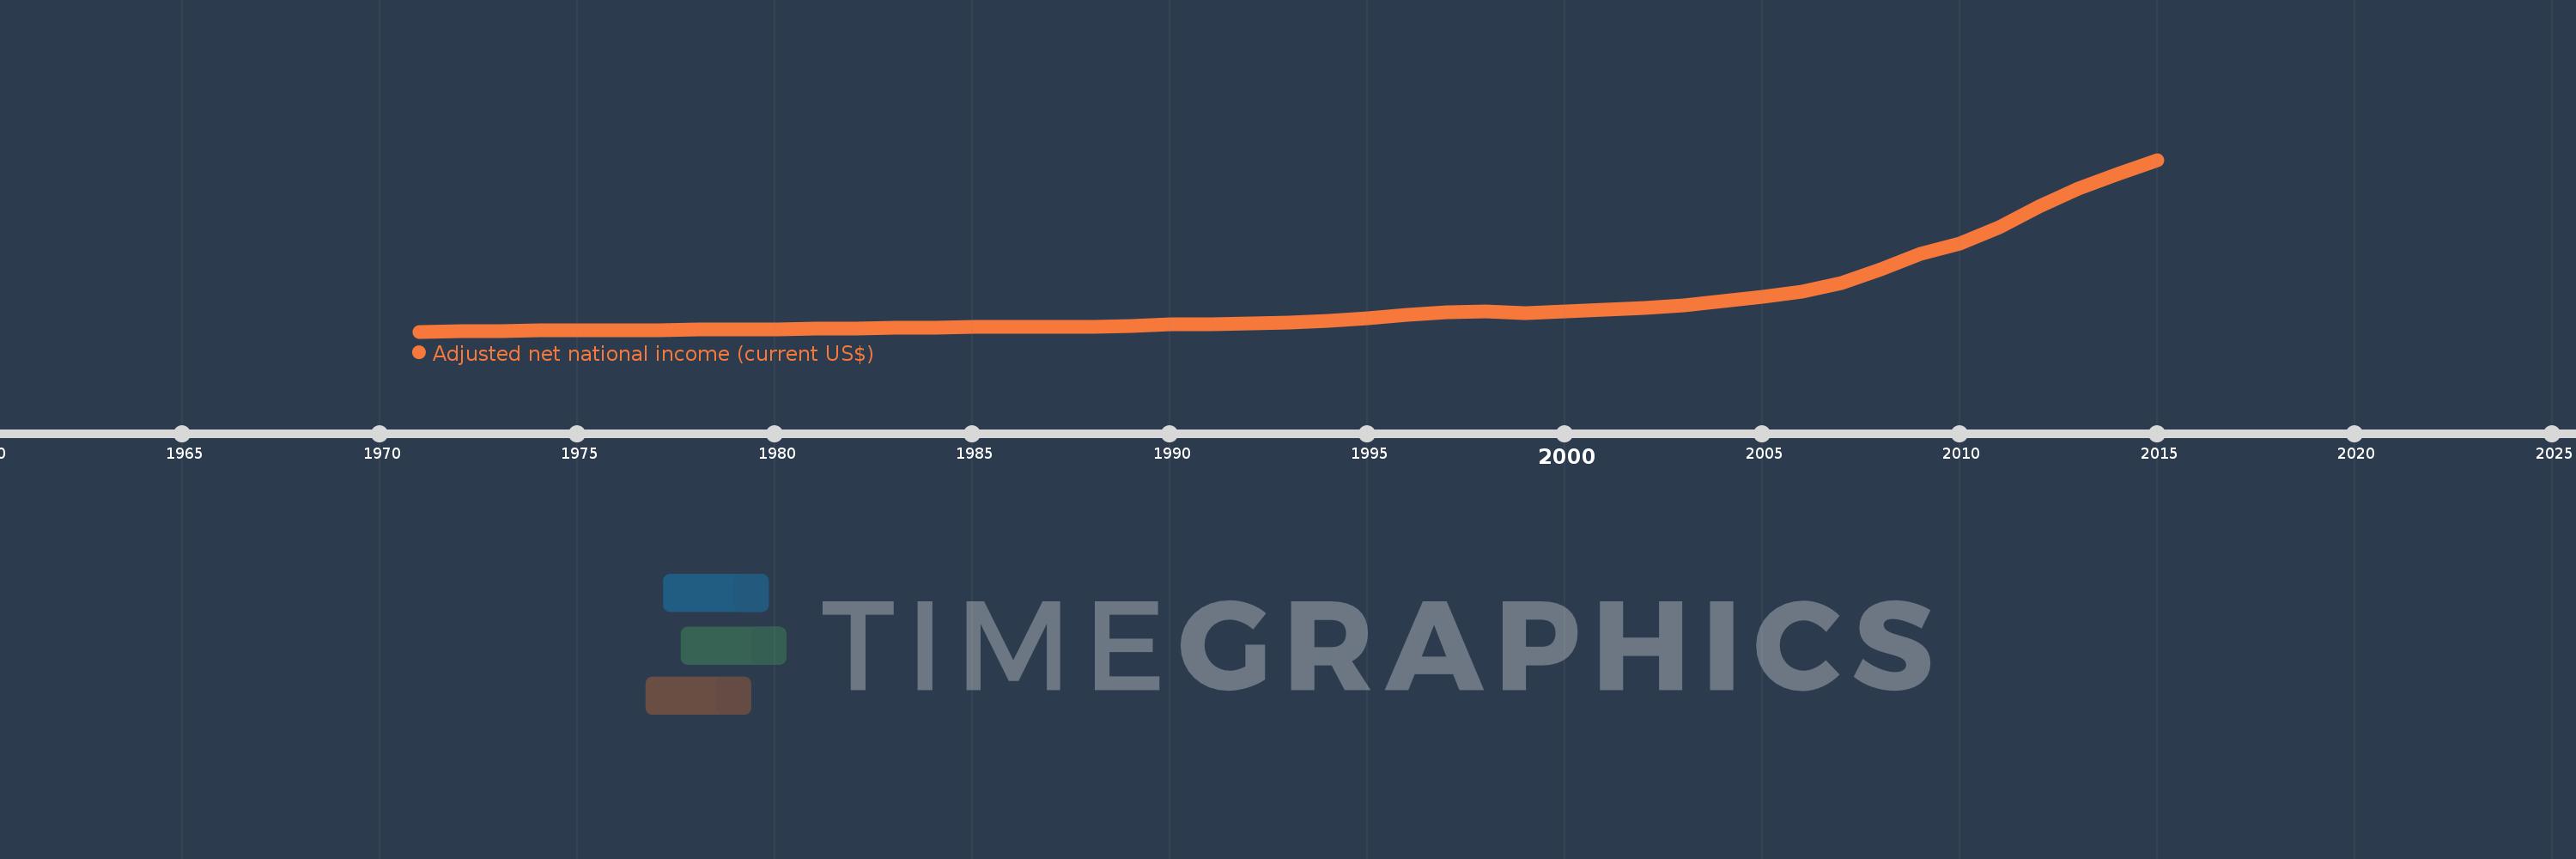
Adjusted net national income (current US$)
2015,2014,2013,2012,2011,2010,2009,2008,2007,2006,2005,2004,2003,2002,2001,2000,1999,1998,1997,1996,1995,1994,1993,1992,1991,1990,1989,1988,1987,1986,1985,1984,1983,1982,1981,1980,1979,1978,1977,1976,1975,1974,1973,1972,1971
This statistics in other country:
AfghanistanAlbaniaAlgeriaAngolaArab WorldArgentinaArmeniaAustraliaAustriaAzerbaijanBahamas, TheBahrainBangladeshBarbadosBelarusBelgiumBelizeBeninBhutanBoliviaBotswanaBrazilBrunei DarussalamBulgariaBurkina FasoBurundiCabo VerdeCambodiaCameroonCanadaCaribbean small statesCentral African RepublicCentral Europe and the BalticsChadChileChinaColombiaComorosCongo, Dem. Rep.Congo, Rep.Costa RicaCote d'IvoireCroatiaCubaCyprusCzech RepublicDenmarkDjiboutiDominicaDominican RepublicEarly-demographic dividendEast Asia & PacificEast Asia & Pacific (excluding high income)East Asia & Pacific (IDA & IBRD countries)EcuadorEgypt, Arab Rep.El SalvadorEquatorial GuineaEritreaEstoniaEthiopiaEuro areaEurope & Central AsiaEurope & Central Asia (excluding high income)Europe & Central Asia (IDA & IBRD countries)European UnionFijiFinlandFragile and conflict affected situationsFranceGabonGambia, TheGeorgiaGermanyGhanaGreeceGuatemalaGuineaGuinea-BissauGuyanaHaitiHeavily indebted poor countries (HIPC)High incomeHondurasHong Kong SAR, ChinaHungaryIBRD onlyIcelandIDA & IBRD totalIDA blendIDA onlyIDA totalIndiaIndonesiaIran, Islamic Rep.IraqIrelandIsraelItalyJamaicaJapanJordanKazakhstanKenyaKiribatiKorea, Rep.KuwaitKyrgyz RepublicLao PDRLate-demographic dividendLatin America & Caribbean Latin America & Caribbean (excluding high income)Latin America & the Caribbean (IDA & IBRD countries)LatviaLeast developed countries: UN classificationLebanonLesothoLiberiaLibyaLithuaniaLow & middle incomeLow incomeLower middle incomeLuxembourgMacedonia, FYRMadagascarMalawiMalaysiaMaldivesMaliMauritaniaMauritiusMexicoMiddle East & North AfricaMiddle East & North Africa (excluding high income)Middle East & North Africa (IDA & IBRD countries)Middle incomeMoldovaMongoliaMoroccoMozambiqueMyanmarNamibiaNepalNetherlandsNew ZealandNicaraguaNigerNigeriaNorth AmericaNorwayOECD membersOmanOther small statesPacific island small statesPakistanPanamaPapua New GuineaParaguayPeruPhilippinesPolandPortugalPost-demographic dividendPre-demographic dividendQatarRomaniaRussian FederationRwandaSamoaSao Tome and PrincipeSaudi ArabiaSenegalSeychellesSierra LeoneSingaporeSlovak RepublicSloveniaSmall statesSolomon IslandsSouth AfricaSouth AsiaSouth Asia (IDA & IBRD)SpainSri LankaSt. LuciaSt. Vincent and the GrenadinesSub-Saharan Africa Sub-Saharan Africa (excluding high income)Sub-Saharan Africa (IDA & IBRD countries)SudanSurinameSwazilandSwedenSwitzerlandSyrian Arab RepublicTajikistanTanzaniaThailandTogoTongaTrinidad and TobagoTunisiaTurkeyTurkmenistanUgandaUkraineUnited Arab EmiratesUnited KingdomUnited StatesUpper middle incomeUruguayUzbekistanVanuatuVenezuela, RBVietnamWorldYemen, Rep.ZambiaZimbabwe Timeline:
This timeline shows a graph from 1971 to 2015 of East Asia & Pacific (excluding high income). No data until 1970. Number of actual observations by date: 45.
Source name:
World Development Indicators
Source organization:
World Bank staff estimates based on sources and methods in World Bank's "The Changing Wealth of Nations: Measuring Sustainable Development in the New Millennium" (2011).
Categories, topics:
Economy & Growth
Last updated:
apr 23, 2017
Indicators value changes by year
Minimum:
112.56 bln
jan 1, 1971
Maximum:
10.683 trl
jan 1, 2015
At the date of observation
Value
Absolute change
Change from previous value
jan 1, 1971
112.56 bln
+112.56 bln
0.0%
jan 1, 1972
120.638 bln
+8.079 bln
7.18%
jan 1, 1973
135.8 bln
+15.161 bln
12.57%
jan 1, 1974
169.879 bln
+34.079 bln
25.1%
jan 1, 1975
185.879 bln
+16.0 bln
9.42%
jan 1, 1976
208.202 bln
+22.323 bln
12.01%
jan 1, 1977
207.58 bln
-622.829 mln
-0.3%
jan 1, 1978
239.533 bln
+31.954 bln
15.39%
jan 1, 1979
232.517 bln
-7.017 bln
-2.93%
jan 1, 1980
249.318 bln
+16.801 bln
7.23%
jan 1, 1981
287.736 bln
+38.418 bln
15.41%
jan 1, 1982
309.739 bln
+22.003 bln
7.65%
jan 1, 1983
327.828 bln
+18.088 bln
5.84%
jan 1, 1984
355.489 bln
+27.661 bln
8.44%
jan 1, 1985
385.245 bln
+29.756 bln
8.37%
jan 1, 1986
427.385 bln
+42.14 bln
10.94%
jan 1, 1987
426.672 bln
-712.19 mln
-0.17%
jan 1, 1988
407.119 bln
-19.554 bln
-4.58%
jan 1, 1989
479.729 bln
+72.61 bln
17.84%
jan 1, 1990
535.79 bln
+56.062 bln
11.69%
jan 1, 1991
565.722 bln
+29.932 bln
5.59%
jan 1, 1992
610.778 bln
+45.056 bln
7.96%
jan 1, 1993
690.042 bln
+79.264 bln
12.98%
jan 1, 1994
759.645 bln
+69.603 bln
10.09%
jan 1, 1995
922.711 bln
+163.066 bln
21.47%
jan 1, 1996
1.128 trl
+205.538 bln
22.28%
jan 1, 1997
1.292 trl
+164.176 bln
14.55%
jan 1, 1998
1.342 trl
+49.545 bln
3.83%
jan 1, 1999
1.229 trl
-112.816 bln
-8.41%
jan 1, 2000
1.351 trl
+122.027 bln
9.93%
jan 1, 2001
1.466 trl
+114.957 bln
8.51%
jan 1, 2002
1.562 trl
+95.867 bln
6.54%
jan 1, 2003
1.739 trl
+176.625 bln
11.31%
jan 1, 2004
1.983 trl
+244.581 bln
14.07%
jan 1, 2005
2.257 trl
+273.532 bln
13.79%
jan 1, 2006
2.575 trl
+318.506 bln
14.11%
jan 1, 2007
3.107 trl
+531.712 bln
20.65%
jan 1, 2008
3.939 trl
+831.903 bln
26.78%
jan 1, 2009
4.875 trl
+936.587 bln
23.78%
jan 1, 2010
5.516 trl
+640.211 bln
13.13%
jan 1, 2011
6.547 trl
+1.032 trl
18.7%
jan 1, 2012
7.816 trl
+1.268 trl
19.37%
jan 1, 2013
8.916 trl
+1.101 trl
14.08%
jan 1, 2014
9.793 trl
+877.19 bln
9.84%
jan 1, 2015
10.683 trl
+889.444 bln
9.08%
Ranking of countries by current statistics by years


Comments: