29
/
en
AIzaSyAYiBZKx7MnpbEhh9jyipgxe19OcubqV5w
April 1, 2024
124395
Egypt, Arab Rep.
EGY
true
2
1
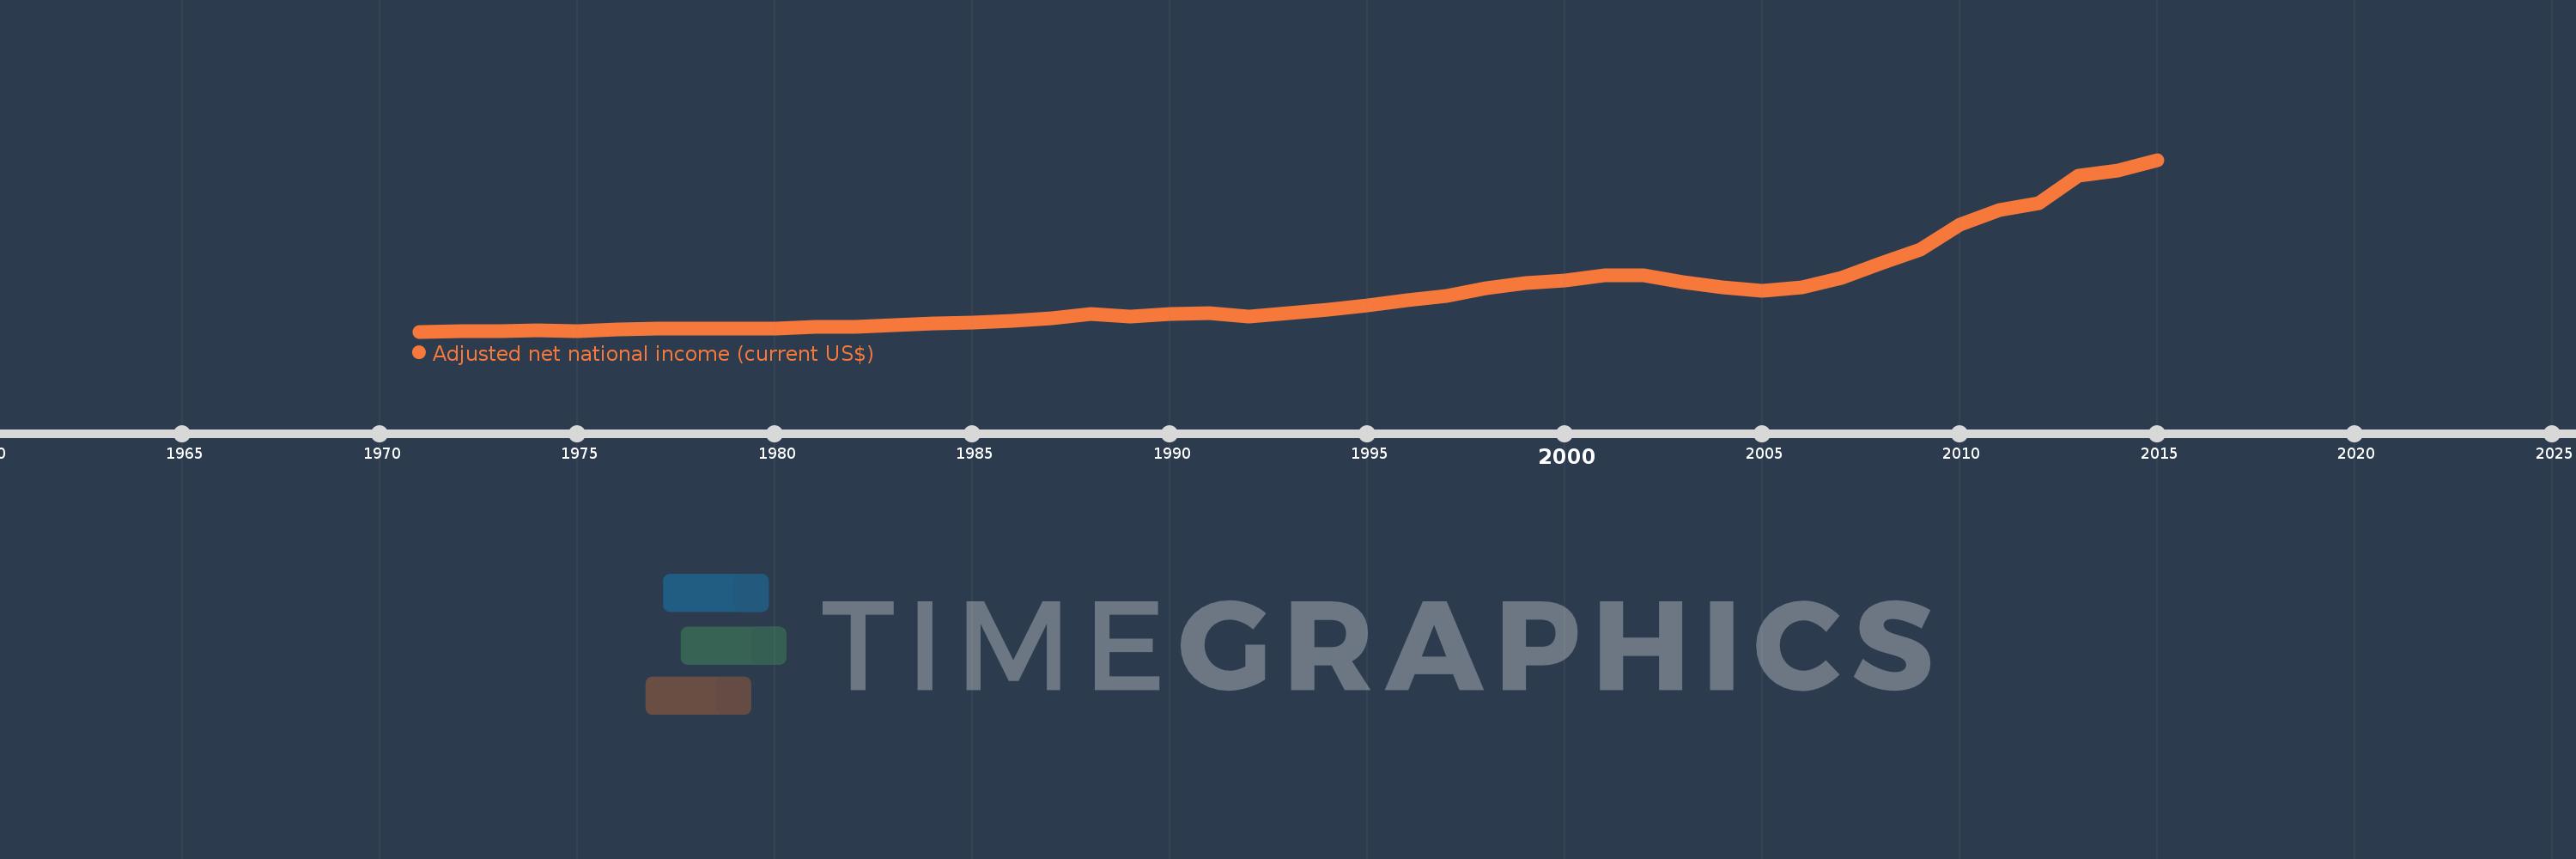
Adjusted net national income (current US$)
2015,2014,2013,2012,2011,2010,2009,2008,2007,2006,2005,2004,2003,2002,2001,2000,1999,1998,1997,1996,1995,1994,1993,1992,1991,1990,1989,1988,1987,1986,1985,1984,1983,1982,1981,1980,1979,1978,1977,1976,1975,1974,1973,1972,1971
This statistics in other country:
AfghanistanAlbaniaAlgeriaAngolaArab WorldArgentinaArmeniaAustraliaAustriaAzerbaijanBahamas, TheBahrainBangladeshBarbadosBelarusBelgiumBelizeBeninBhutanBoliviaBotswanaBrazilBrunei DarussalamBulgariaBurkina FasoBurundiCabo VerdeCambodiaCameroonCanadaCaribbean small statesCentral African RepublicCentral Europe and the BalticsChadChileChinaColombiaComorosCongo, Dem. Rep.Congo, Rep.Costa RicaCote d'IvoireCroatiaCubaCyprusCzech RepublicDenmarkDjiboutiDominicaDominican RepublicEarly-demographic dividendEast Asia & PacificEast Asia & Pacific (excluding high income)East Asia & Pacific (IDA & IBRD countries)EcuadorEgypt, Arab Rep.El SalvadorEquatorial GuineaEritreaEstoniaEthiopiaEuro areaEurope & Central AsiaEurope & Central Asia (excluding high income)Europe & Central Asia (IDA & IBRD countries)European UnionFijiFinlandFragile and conflict affected situationsFranceGabonGambia, TheGeorgiaGermanyGhanaGreeceGuatemalaGuineaGuinea-BissauGuyanaHaitiHeavily indebted poor countries (HIPC)High incomeHondurasHong Kong SAR, ChinaHungaryIBRD onlyIcelandIDA & IBRD totalIDA blendIDA onlyIDA totalIndiaIndonesiaIran, Islamic Rep.IraqIrelandIsraelItalyJamaicaJapanJordanKazakhstanKenyaKiribatiKorea, Rep.KuwaitKyrgyz RepublicLao PDRLate-demographic dividendLatin America & Caribbean Latin America & Caribbean (excluding high income)Latin America & the Caribbean (IDA & IBRD countries)LatviaLeast developed countries: UN classificationLebanonLesothoLiberiaLibyaLithuaniaLow & middle incomeLow incomeLower middle incomeLuxembourgMacedonia, FYRMadagascarMalawiMalaysiaMaldivesMaliMauritaniaMauritiusMexicoMiddle East & North AfricaMiddle East & North Africa (excluding high income)Middle East & North Africa (IDA & IBRD countries)Middle incomeMoldovaMongoliaMoroccoMozambiqueMyanmarNamibiaNepalNetherlandsNew ZealandNicaraguaNigerNigeriaNorth AmericaNorwayOECD membersOmanOther small statesPacific island small statesPakistanPanamaPapua New GuineaParaguayPeruPhilippinesPolandPortugalPost-demographic dividendPre-demographic dividendQatarRomaniaRussian FederationRwandaSamoaSao Tome and PrincipeSaudi ArabiaSenegalSeychellesSierra LeoneSingaporeSlovak RepublicSloveniaSmall statesSolomon IslandsSouth AfricaSouth AsiaSouth Asia (IDA & IBRD)SpainSri LankaSt. LuciaSt. Vincent and the GrenadinesSub-Saharan Africa Sub-Saharan Africa (excluding high income)Sub-Saharan Africa (IDA & IBRD countries)SudanSurinameSwazilandSwedenSwitzerlandSyrian Arab RepublicTajikistanTanzaniaThailandTogoTongaTrinidad and TobagoTunisiaTurkeyTurkmenistanUgandaUkraineUnited Arab EmiratesUnited KingdomUnited StatesUpper middle incomeUruguayUzbekistanVanuatuVenezuela, RBVietnamWorldYemen, Rep.ZambiaZimbabwe Timeline:
This timeline shows a graph from 1971 to 2015 of Egypt, Arab Rep.. No data until 1970. Number of actual observations by date: 45.
Source name:
World Development Indicators
Source organization:
World Bank staff estimates based on sources and methods in World Bank's "The Changing Wealth of Nations: Measuring Sustainable Development in the New Millennium" (2011).
Categories, topics:
Economy & Growth
Last updated:
apr 23, 2017
Indicators value changes by year
Minimum:
7.155 bln
jan 1, 1971
Maximum:
255.583 bln
jan 1, 2015
At the date of observation
Value
Absolute change
Change from previous value
jan 1, 1971
7.155 bln
+7.155 bln
0.0%
jan 1, 1972
7.679 bln
+523.278 mln
7.31%
jan 1, 1973
8.173 bln
+494.486 mln
6.44%
jan 1, 1974
8.895 bln
+721.521 mln
8.83%
jan 1, 1975
8.113 bln
-781.643 mln
-8.79%
jan 1, 1976
10.024 bln
+1.911 bln
23.56%
jan 1, 1977
11.406 bln
+1.382 bln
13.79%
jan 1, 1978
12.02 bln
+613.849 mln
5.38%
jan 1, 1979
11.528 bln
-491.968 mln
-4.09%
jan 1, 1980
11.559 bln
+31.541 mln
0.27%
jan 1, 1981
13.874 bln
+2.315 bln
20.03%
jan 1, 1982
14.098 bln
+223.534 mln
1.61%
jan 1, 1983
16.256 bln
+2.159 bln
15.31%
jan 1, 1984
18.756 bln
+2.5 bln
15.38%
jan 1, 1985
20.061 bln
+1.305 bln
6.96%
jan 1, 1986
22.354 bln
+2.293 bln
11.43%
jan 1, 1987
26.555 bln
+4.2 bln
18.79%
jan 1, 1988
32.854 bln
+6.299 bln
23.72%
jan 1, 1989
29.13 bln
-3.723 bln
-11.33%
jan 1, 1990
32.403 bln
+3.273 bln
11.24%
jan 1, 1991
33.317 bln
+913.397 mln
2.82%
jan 1, 1992
29.365 bln
-3.952 bln
-11.86%
jan 1, 1993
33.993 bln
+4.628 bln
15.76%
jan 1, 1994
38.697 bln
+4.704 bln
13.84%
jan 1, 1995
44.594 bln
+5.897 bln
15.24%
jan 1, 1996
52.229 bln
+7.635 bln
17.12%
jan 1, 1997
58.673 bln
+6.444 bln
12.34%
jan 1, 1998
69.778 bln
+11.104 bln
18.93%
jan 1, 1999
77.752 bln
+7.974 bln
11.43%
jan 1, 2000
81.471 bln
+3.719 bln
4.78%
jan 1, 2001
88.461 bln
+6.99 bln
8.58%
jan 1, 2002
88.517 bln
+56.9 mln
0.06%
jan 1, 2003
78.181 bln
-10.337 bln
-11.68%
jan 1, 2004
71.428 bln
-6.753 bln
-8.64%
jan 1, 2005
65.624 bln
-5.804 bln
-8.13%
jan 1, 2006
70.96 bln
+5.336 bln
8.13%
jan 1, 2007
85.172 bln
+14.212 bln
20.03%
jan 1, 2008
105.939 bln
+20.766 bln
24.38%
jan 1, 2009
126.007 bln
+20.069 bln
18.94%
jan 1, 2010
161.425 bln
+35.418 bln
28.11%
jan 1, 2011
182.983 bln
+21.557 bln
13.35%
jan 1, 2012
193.383 bln
+10.4 bln
5.68%
jan 1, 2013
232.496 bln
+39.114 bln
20.23%
jan 1, 2014
239.658 bln
+7.161 bln
3.08%
jan 1, 2015
255.583 bln
+15.925 bln
6.64%
Ranking of countries by current statistics by years


Comments: