29
/
en
AIzaSyAYiBZKx7MnpbEhh9jyipgxe19OcubqV5w
April 1, 2024
57826
South Asia (IDA & IBRD)
TSA
false
2
1
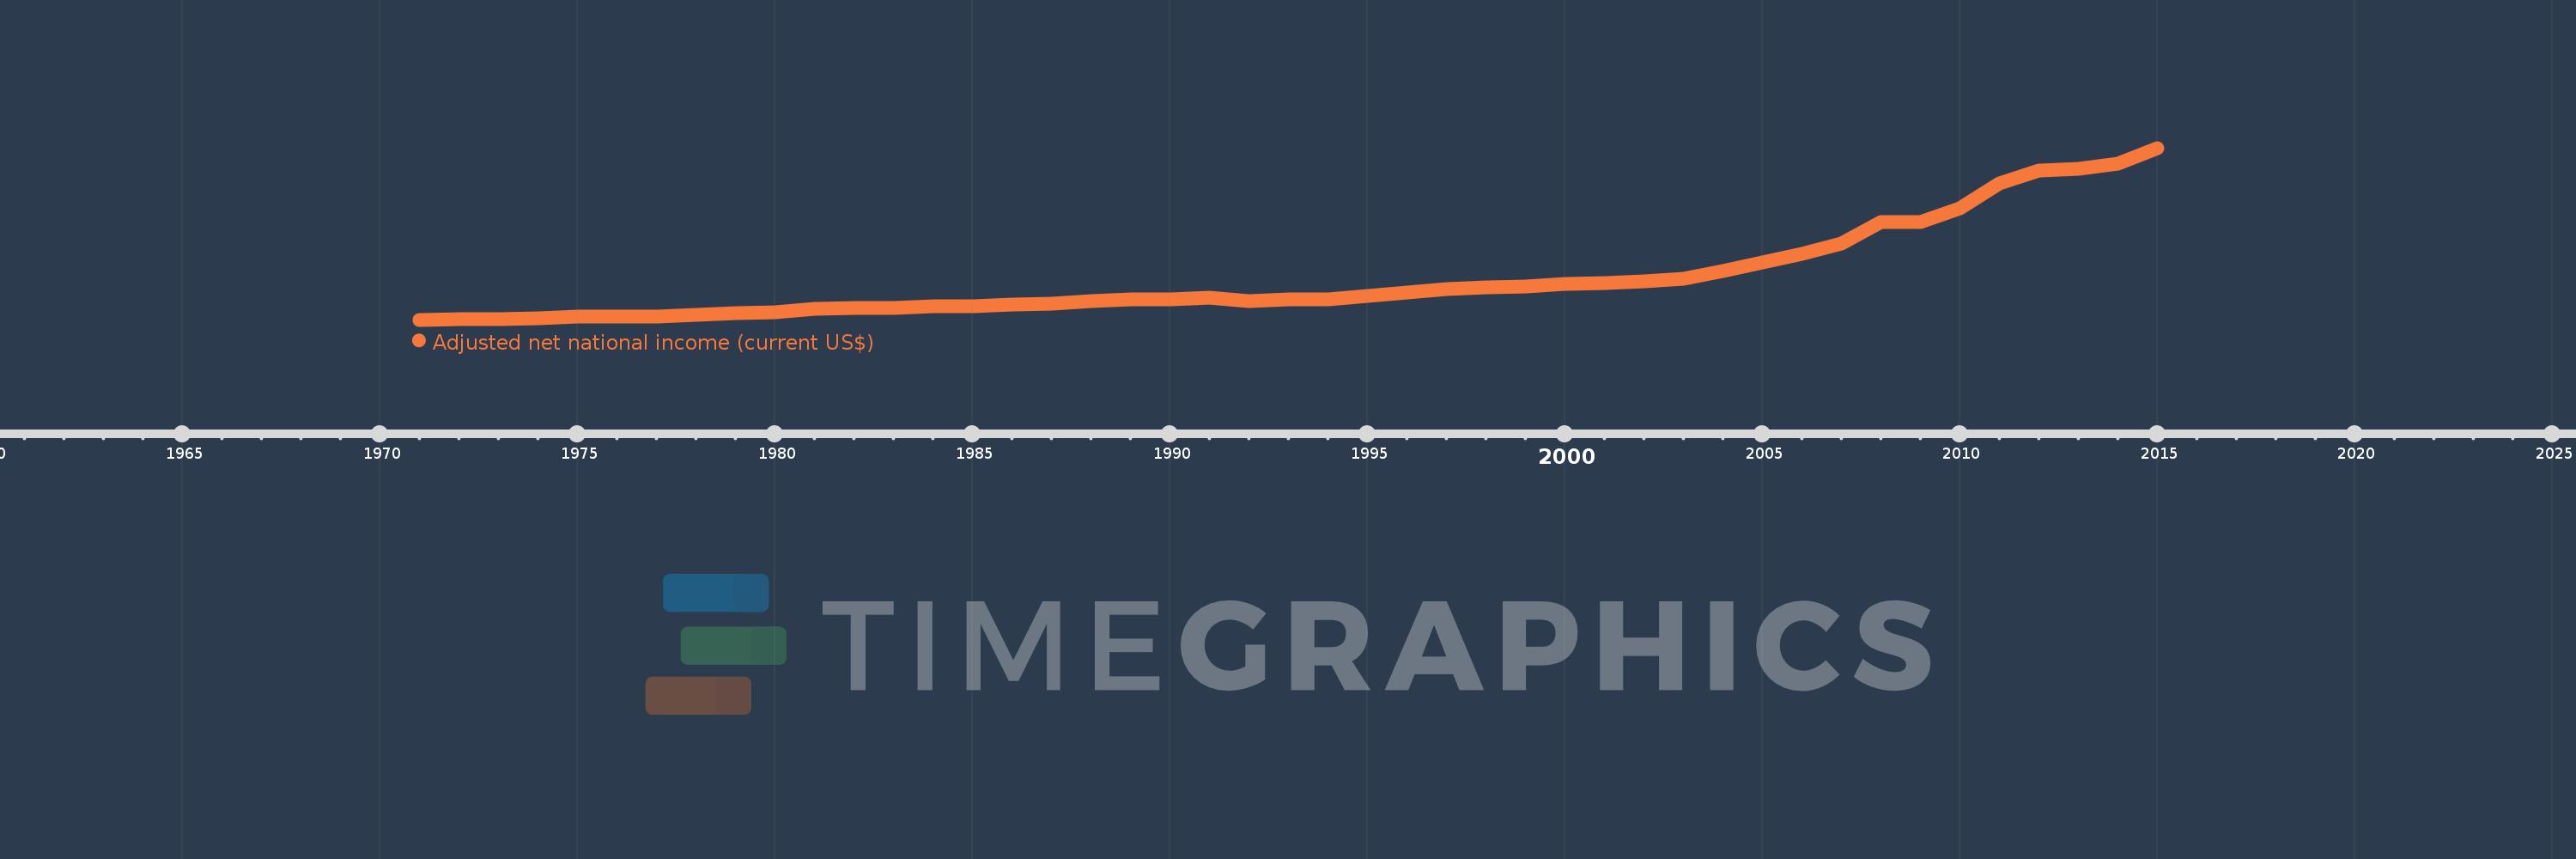
Adjusted net national income (current US$)
2015,2014,2013,2012,2011,2010,2009,2008,2007,2006,2005,2004,2003,2002,2001,2000,1999,1998,1997,1996,1995,1994,1993,1992,1991,1990,1989,1988,1987,1986,1985,1984,1983,1982,1981,1980,1979,1978,1977,1976,1975,1974,1973,1972,1971
This statistics in other country:
AfghanistanAlbaniaAlgeriaAngolaArab WorldArgentinaArmeniaAustraliaAustriaAzerbaijanBahamas, TheBahrainBangladeshBarbadosBelarusBelgiumBelizeBeninBhutanBoliviaBotswanaBrazilBrunei DarussalamBulgariaBurkina FasoBurundiCabo VerdeCambodiaCameroonCanadaCaribbean small statesCentral African RepublicCentral Europe and the BalticsChadChileChinaColombiaComorosCongo, Dem. Rep.Congo, Rep.Costa RicaCote d'IvoireCroatiaCubaCyprusCzech RepublicDenmarkDjiboutiDominicaDominican RepublicEarly-demographic dividendEast Asia & PacificEast Asia & Pacific (excluding high income)East Asia & Pacific (IDA & IBRD countries)EcuadorEgypt, Arab Rep.El SalvadorEquatorial GuineaEritreaEstoniaEthiopiaEuro areaEurope & Central AsiaEurope & Central Asia (excluding high income)Europe & Central Asia (IDA & IBRD countries)European UnionFijiFinlandFragile and conflict affected situationsFranceGabonGambia, TheGeorgiaGermanyGhanaGreeceGuatemalaGuineaGuinea-BissauGuyanaHaitiHeavily indebted poor countries (HIPC)High incomeHondurasHong Kong SAR, ChinaHungaryIBRD onlyIcelandIDA & IBRD totalIDA blendIDA onlyIDA totalIndiaIndonesiaIran, Islamic Rep.IraqIrelandIsraelItalyJamaicaJapanJordanKazakhstanKenyaKiribatiKorea, Rep.KuwaitKyrgyz RepublicLao PDRLate-demographic dividendLatin America & Caribbean Latin America & Caribbean (excluding high income)Latin America & the Caribbean (IDA & IBRD countries)LatviaLeast developed countries: UN classificationLebanonLesothoLiberiaLibyaLithuaniaLow & middle incomeLow incomeLower middle incomeLuxembourgMacedonia, FYRMadagascarMalawiMalaysiaMaldivesMaliMauritaniaMauritiusMexicoMiddle East & North AfricaMiddle East & North Africa (excluding high income)Middle East & North Africa (IDA & IBRD countries)Middle incomeMoldovaMongoliaMoroccoMozambiqueMyanmarNamibiaNepalNetherlandsNew ZealandNicaraguaNigerNigeriaNorth AmericaNorwayOECD membersOmanOther small statesPacific island small statesPakistanPanamaPapua New GuineaParaguayPeruPhilippinesPolandPortugalPost-demographic dividendPre-demographic dividendQatarRomaniaRussian FederationRwandaSamoaSao Tome and PrincipeSaudi ArabiaSenegalSeychellesSierra LeoneSingaporeSlovak RepublicSloveniaSmall statesSolomon IslandsSouth AfricaSouth AsiaSouth Asia (IDA & IBRD)SpainSri LankaSt. LuciaSt. Vincent and the GrenadinesSub-Saharan Africa Sub-Saharan Africa (excluding high income)Sub-Saharan Africa (IDA & IBRD countries)SudanSurinameSwazilandSwedenSwitzerlandSyrian Arab RepublicTajikistanTanzaniaThailandTogoTongaTrinidad and TobagoTunisiaTurkeyTurkmenistanUgandaUkraineUnited Arab EmiratesUnited KingdomUnited StatesUpper middle incomeUruguayUzbekistanVanuatuVenezuela, RBVietnamWorldYemen, Rep.ZambiaZimbabwe Timeline:
This timeline shows a graph from 1971 to 2015 of South Asia (IDA & IBRD). No data until 1970. Number of actual observations by date: 45.
Source name:
World Development Indicators
Source organization:
World Bank staff estimates based on sources and methods in World Bank's "The Changing Wealth of Nations: Measuring Sustainable Development in the New Millennium" (2011).
Categories, topics:
Economy & Growth
Last updated:
apr 23, 2017
Indicators value changes by year
Minimum:
76.542 bln
jan 1, 1971
Maximum:
2.262 trl
jan 1, 2015
At the date of observation
Value
Absolute change
Change from previous value
jan 1, 1971
76.542 bln
+76.542 bln
0.0%
jan 1, 1972
82.769 bln
+6.228 bln
8.14%
jan 1, 1973
85.505 bln
+2.735 bln
3.3%
jan 1, 1974
96.832 bln
+11.327 bln
13.25%
jan 1, 1975
116.44 bln
+19.608 bln
20.25%
jan 1, 1976
120.941 bln
+4.501 bln
3.87%
jan 1, 1977
119.978 bln
-962.346 mln
-0.8%
jan 1, 1978
138.662 bln
+18.683 bln
15.57%
jan 1, 1979
158.877 bln
+20.215 bln
14.58%
jan 1, 1980
176.323 bln
+17.446 bln
10.98%
jan 1, 1981
212.163 bln
+35.84 bln
20.33%
jan 1, 1982
225.231 bln
+13.068 bln
6.16%
jan 1, 1983
228.491 bln
+3.26 bln
1.45%
jan 1, 1984
246.353 bln
+17.862 bln
7.82%
jan 1, 1985
244.065 bln
-2.288 bln
-0.93%
jan 1, 1986
265.649 bln
+21.585 bln
8.84%
jan 1, 1987
280.008 bln
+14.359 bln
5.41%
jan 1, 1988
312.742 bln
+32.733 bln
11.69%
jan 1, 1989
335.434 bln
+22.693 bln
7.26%
jan 1, 1990
336.892 bln
+1.458 bln
0.43%
jan 1, 1991
359.086 bln
+22.194 bln
6.59%
jan 1, 1992
316.522 bln
-42.565 bln
-11.85%
jan 1, 1993
335.925 bln
+19.403 bln
6.13%
jan 1, 1994
333.529 bln
-2.395 bln
-0.71%
jan 1, 1995
380.715 bln
+47.185 bln
14.15%
jan 1, 1996
421.638 bln
+40.923 bln
10.75%
jan 1, 1997
461.558 bln
+39.921 bln
9.47%
jan 1, 1998
485.877 bln
+24.319 bln
5.27%
jan 1, 1999
495.76 bln
+9.884 bln
2.03%
jan 1, 2000
532.66 bln
+36.9 bln
7.44%
jan 1, 2001
547.656 bln
+14.996 bln
2.82%
jan 1, 2002
561.529 bln
+13.873 bln
2.53%
jan 1, 2003
593.123 bln
+31.594 bln
5.63%
jan 1, 2004
692.334 bln
+99.211 bln
16.73%
jan 1, 2005
806.811 bln
+114.477 bln
16.53%
jan 1, 2006
919.323 bln
+112.512 bln
13.95%
jan 1, 2007
1.045 trl
+126.132 bln
13.72%
jan 1, 2008
1.323 trl
+277.24 bln
26.52%
jan 1, 2009
1.322 trl
-628.924 mln
-0.05%
jan 1, 2010
1.499 trl
+176.791 bln
13.37%
jan 1, 2011
1.808 trl
+308.787 bln
20.6%
jan 1, 2012
1.972 trl
+164.189 bln
9.08%
jan 1, 2013
1.999 trl
+27.597 bln
1.4%
jan 1, 2014
2.064 trl
+64.164 bln
3.21%
jan 1, 2015
2.262 trl
+198.572 bln
9.62%
Ranking of countries by current statistics by years


Comments: