29
/
en
AIzaSyAYiBZKx7MnpbEhh9jyipgxe19OcubqV5w
April 1, 2024
186100
Malawi
MWI
true
2
1
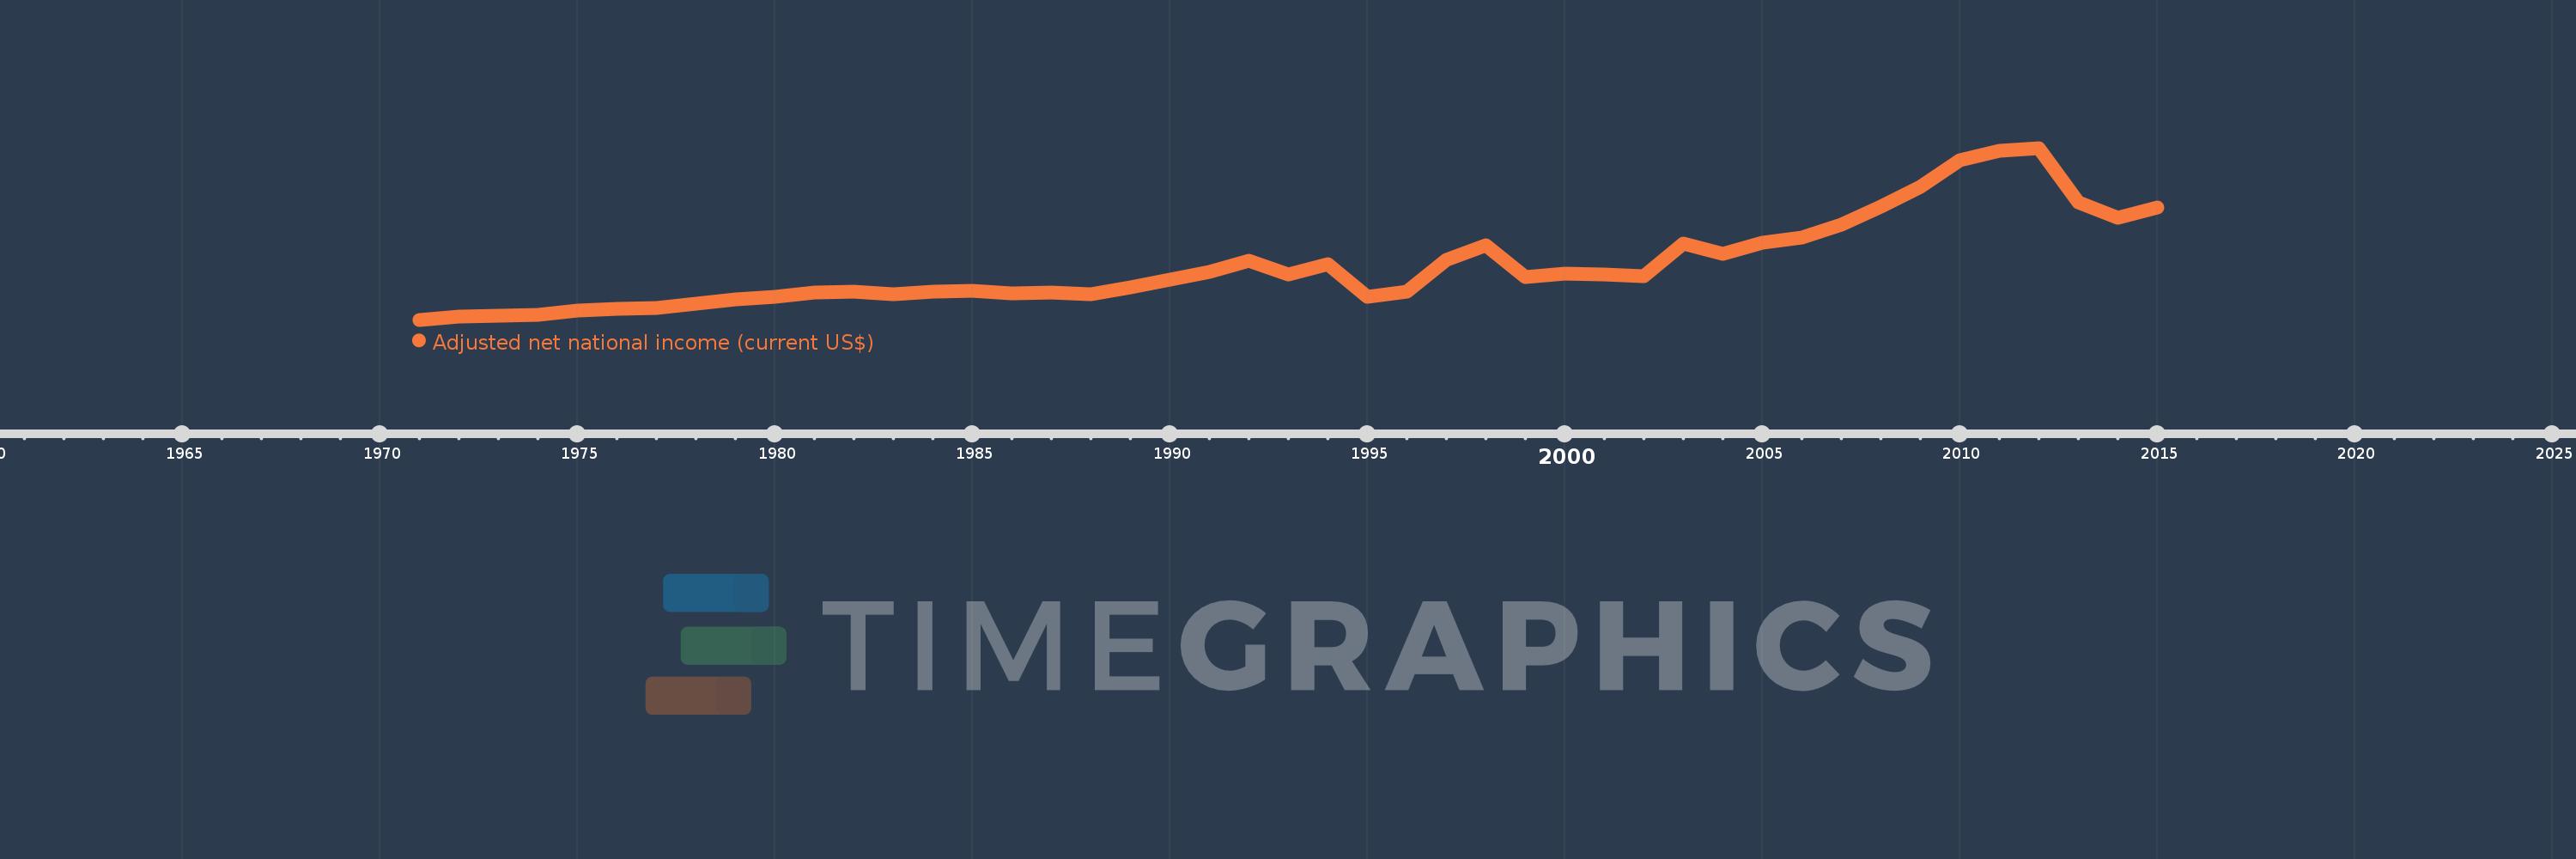
Adjusted net national income (current US$)
2015,2014,2013,2012,2011,2010,2009,2008,2007,2006,2005,2004,2003,2002,2001,2000,1999,1998,1997,1996,1995,1994,1993,1992,1991,1990,1989,1988,1987,1986,1985,1984,1983,1982,1981,1980,1979,1978,1977,1976,1975,1974,1973,1972,1971
This statistics in other country:
AfghanistanAlbaniaAlgeriaAngolaArab WorldArgentinaArmeniaAustraliaAustriaAzerbaijanBahamas, TheBahrainBangladeshBarbadosBelarusBelgiumBelizeBeninBhutanBoliviaBotswanaBrazilBrunei DarussalamBulgariaBurkina FasoBurundiCabo VerdeCambodiaCameroonCanadaCaribbean small statesCentral African RepublicCentral Europe and the BalticsChadChileChinaColombiaComorosCongo, Dem. Rep.Congo, Rep.Costa RicaCote d'IvoireCroatiaCubaCyprusCzech RepublicDenmarkDjiboutiDominicaDominican RepublicEarly-demographic dividendEast Asia & PacificEast Asia & Pacific (excluding high income)East Asia & Pacific (IDA & IBRD countries)EcuadorEgypt, Arab Rep.El SalvadorEquatorial GuineaEritreaEstoniaEthiopiaEuro areaEurope & Central AsiaEurope & Central Asia (excluding high income)Europe & Central Asia (IDA & IBRD countries)European UnionFijiFinlandFragile and conflict affected situationsFranceGabonGambia, TheGeorgiaGermanyGhanaGreeceGuatemalaGuineaGuinea-BissauGuyanaHaitiHeavily indebted poor countries (HIPC)High incomeHondurasHong Kong SAR, ChinaHungaryIBRD onlyIcelandIDA & IBRD totalIDA blendIDA onlyIDA totalIndiaIndonesiaIran, Islamic Rep.IraqIrelandIsraelItalyJamaicaJapanJordanKazakhstanKenyaKiribatiKorea, Rep.KuwaitKyrgyz RepublicLao PDRLate-demographic dividendLatin America & Caribbean Latin America & Caribbean (excluding high income)Latin America & the Caribbean (IDA & IBRD countries)LatviaLeast developed countries: UN classificationLebanonLesothoLiberiaLibyaLithuaniaLow & middle incomeLow incomeLower middle incomeLuxembourgMacedonia, FYRMadagascarMalawiMalaysiaMaldivesMaliMauritaniaMauritiusMexicoMiddle East & North AfricaMiddle East & North Africa (excluding high income)Middle East & North Africa (IDA & IBRD countries)Middle incomeMoldovaMongoliaMoroccoMozambiqueMyanmarNamibiaNepalNetherlandsNew ZealandNicaraguaNigerNigeriaNorth AmericaNorwayOECD membersOmanOther small statesPacific island small statesPakistanPanamaPapua New GuineaParaguayPeruPhilippinesPolandPortugalPost-demographic dividendPre-demographic dividendQatarRomaniaRussian FederationRwandaSamoaSao Tome and PrincipeSaudi ArabiaSenegalSeychellesSierra LeoneSingaporeSlovak RepublicSloveniaSmall statesSolomon IslandsSouth AfricaSouth AsiaSouth Asia (IDA & IBRD)SpainSri LankaSt. LuciaSt. Vincent and the GrenadinesSub-Saharan Africa Sub-Saharan Africa (excluding high income)Sub-Saharan Africa (IDA & IBRD countries)SudanSurinameSwazilandSwedenSwitzerlandSyrian Arab RepublicTajikistanTanzaniaThailandTogoTongaTrinidad and TobagoTunisiaTurkeyTurkmenistanUgandaUkraineUnited Arab EmiratesUnited KingdomUnited StatesUpper middle incomeUruguayUzbekistanVanuatuVenezuela, RBVietnamWorldYemen, Rep.ZambiaZimbabwe Timeline:
This timeline shows a graph from 1971 to 2015 of Malawi. No data until 1970. Number of actual observations by date: 45.
Source name:
World Development Indicators
Source organization:
World Bank staff estimates based on sources and methods in World Bank's "The Changing Wealth of Nations: Measuring Sustainable Development in the New Millennium" (2011).
Categories, topics:
Economy & Growth
Last updated:
apr 23, 2017
Indicators value changes by year
Minimum:
269.41 mln
jan 1, 1971
Maximum:
4.871 bln
jan 1, 2012
At the date of observation
Value
Absolute change
Change from previous value
jan 1, 1971
269.41 mln
+269.41 mln
0.0%
jan 1, 1972
348.727 mln
+79.317 mln
29.44%
jan 1, 1973
386.433 mln
+37.706 mln
10.81%
jan 1, 1974
403.035 mln
+16.602 mln
4.3%
jan 1, 1975
515.175 mln
+112.14 mln
27.82%
jan 1, 1976
550.13 mln
+34.955 mln
6.79%
jan 1, 1977
574.525 mln
+24.395 mln
4.43%
jan 1, 1978
697.592 mln
+123.067 mln
21.42%
jan 1, 1979
809.815 mln
+112.223 mln
16.09%
jan 1, 1980
873.25 mln
+63.435 mln
7.83%
jan 1, 1981
1.004 bln
+131.106 mln
15.01%
jan 1, 1982
1.022 bln
+17.829 mln
1.78%
jan 1, 1983
959.72 mln
-62.465 mln
-6.11%
jan 1, 1984
1.032 bln
+71.949 mln
7.5%
jan 1, 1985
1.045 bln
+13.547 mln
1.31%
jan 1, 1986
984.323 mln
-60.894 mln
-5.83%
jan 1, 1987
995.522 mln
+11.199 mln
1.14%
jan 1, 1988
951.934 mln
-43.588 mln
-4.38%
jan 1, 1989
1.139 bln
+187.005 mln
19.64%
jan 1, 1990
1.334 bln
+195.181 mln
17.14%
jan 1, 1991
1.551 bln
+216.404 mln
16.22%
jan 1, 1992
1.858 bln
+307.041 mln
19.8%
jan 1, 1993
1.488 bln
-369.437 mln
-19.89%
jan 1, 1994
1.753 bln
+264.47 mln
17.77%
jan 1, 1995
874.466 mln
-878.132 mln
-50.1%
jan 1, 1996
1.023 bln
+148.931 mln
17.03%
jan 1, 1997
1.864 bln
+840.512 mln
82.13%
jan 1, 1998
2.267 bln
+402.97 mln
21.62%
jan 1, 1999
1.419 bln
-848.091 mln
-37.41%
jan 1, 2000
1.494 bln
+74.775 mln
5.27%
jan 1, 2001
1.472 bln
-21.414 mln
-1.43%
jan 1, 2002
1.442 bln
-30.511 mln
-2.07%
jan 1, 2003
2.31 bln
+868.301 mln
60.23%
jan 1, 2004
2.023 bln
-286.88 mln
-12.42%
jan 1, 2005
2.332 bln
+309.296 mln
15.29%
jan 1, 2006
2.466 bln
+133.28 mln
5.71%
jan 1, 2007
2.815 bln
+349.588 mln
14.18%
jan 1, 2008
3.299 bln
+483.746 mln
17.18%
jan 1, 2009
3.825 bln
+525.895 mln
15.94%
jan 1, 2010
4.532 bln
+706.707 mln
18.48%
jan 1, 2011
4.8 bln
+268.009 mln
5.91%
jan 1, 2012
4.871 bln
+70.925 mln
1.48%
jan 1, 2013
3.424 bln
-1.447 bln
-29.7%
jan 1, 2014
3.004 bln
-419.417 mln
-12.25%
jan 1, 2015
3.279 bln
+274.91 mln
9.15%
Ranking of countries by current statistics by years


Comments: