29
/
en
AIzaSyAYiBZKx7MnpbEhh9jyipgxe19OcubqV5w
April 1, 2024
102080
Central African Republic
CAF
true
2
1
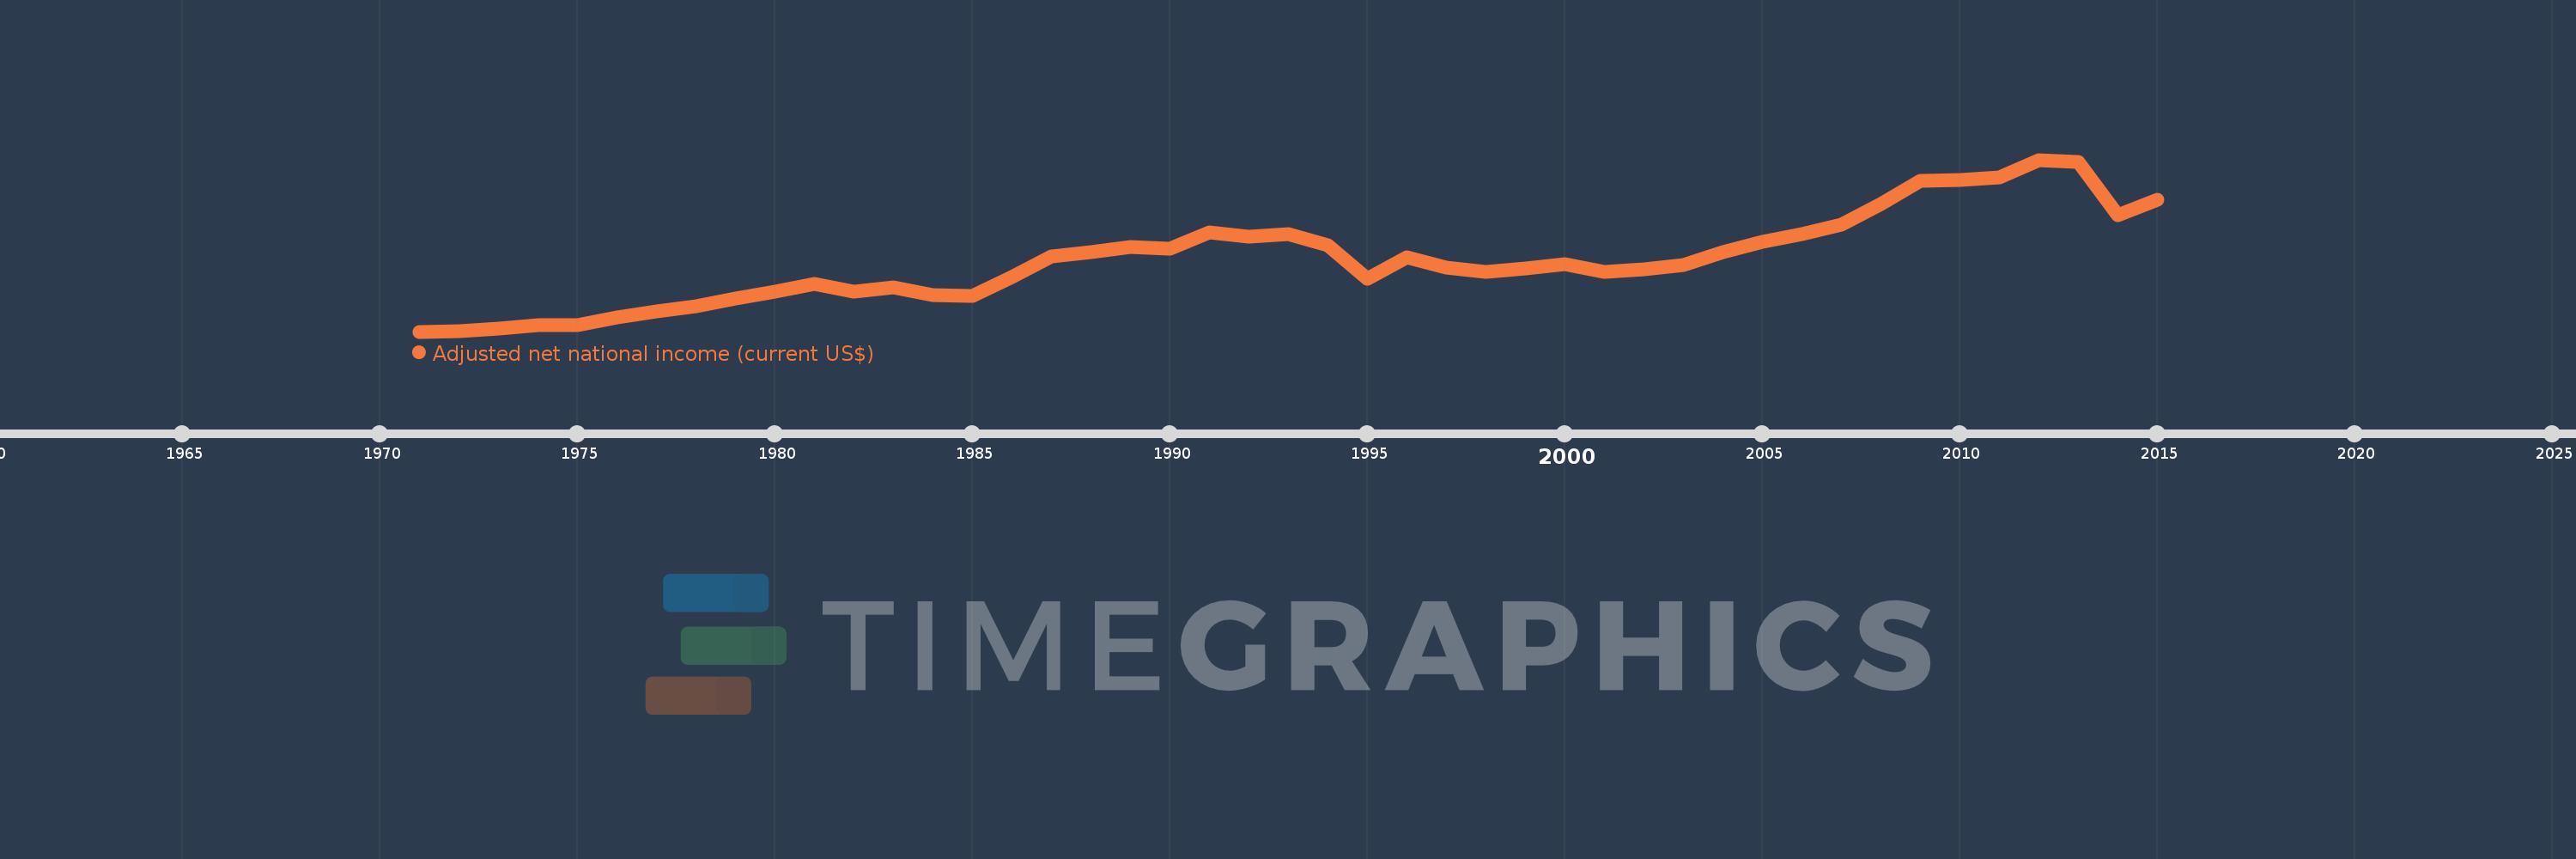
Adjusted net national income (current US$)
2015,2014,2013,2012,2011,2010,2009,2008,2007,2006,2005,2004,2003,2002,2001,2000,1999,1998,1997,1996,1995,1994,1993,1992,1991,1990,1989,1988,1987,1986,1985,1984,1983,1982,1981,1980,1979,1978,1977,1976,1975,1974,1973,1972,1971
This statistics in other country:
AfghanistanAlbaniaAlgeriaAngolaArab WorldArgentinaArmeniaAustraliaAustriaAzerbaijanBahamas, TheBahrainBangladeshBarbadosBelarusBelgiumBelizeBeninBhutanBoliviaBotswanaBrazilBrunei DarussalamBulgariaBurkina FasoBurundiCabo VerdeCambodiaCameroonCanadaCaribbean small statesCentral African RepublicCentral Europe and the BalticsChadChileChinaColombiaComorosCongo, Dem. Rep.Congo, Rep.Costa RicaCote d'IvoireCroatiaCubaCyprusCzech RepublicDenmarkDjiboutiDominicaDominican RepublicEarly-demographic dividendEast Asia & PacificEast Asia & Pacific (excluding high income)East Asia & Pacific (IDA & IBRD countries)EcuadorEgypt, Arab Rep.El SalvadorEquatorial GuineaEritreaEstoniaEthiopiaEuro areaEurope & Central AsiaEurope & Central Asia (excluding high income)Europe & Central Asia (IDA & IBRD countries)European UnionFijiFinlandFragile and conflict affected situationsFranceGabonGambia, TheGeorgiaGermanyGhanaGreeceGuatemalaGuineaGuinea-BissauGuyanaHaitiHeavily indebted poor countries (HIPC)High incomeHondurasHong Kong SAR, ChinaHungaryIBRD onlyIcelandIDA & IBRD totalIDA blendIDA onlyIDA totalIndiaIndonesiaIran, Islamic Rep.IraqIrelandIsraelItalyJamaicaJapanJordanKazakhstanKenyaKiribatiKorea, Rep.KuwaitKyrgyz RepublicLao PDRLate-demographic dividendLatin America & Caribbean Latin America & Caribbean (excluding high income)Latin America & the Caribbean (IDA & IBRD countries)LatviaLeast developed countries: UN classificationLebanonLesothoLiberiaLibyaLithuaniaLow & middle incomeLow incomeLower middle incomeLuxembourgMacedonia, FYRMadagascarMalawiMalaysiaMaldivesMaliMauritaniaMauritiusMexicoMiddle East & North AfricaMiddle East & North Africa (excluding high income)Middle East & North Africa (IDA & IBRD countries)Middle incomeMoldovaMongoliaMoroccoMozambiqueMyanmarNamibiaNepalNetherlandsNew ZealandNicaraguaNigerNigeriaNorth AmericaNorwayOECD membersOmanOther small statesPacific island small statesPakistanPanamaPapua New GuineaParaguayPeruPhilippinesPolandPortugalPost-demographic dividendPre-demographic dividendQatarRomaniaRussian FederationRwandaSamoaSao Tome and PrincipeSaudi ArabiaSenegalSeychellesSierra LeoneSingaporeSlovak RepublicSloveniaSmall statesSolomon IslandsSouth AfricaSouth AsiaSouth Asia (IDA & IBRD)SpainSri LankaSt. LuciaSt. Vincent and the GrenadinesSub-Saharan Africa Sub-Saharan Africa (excluding high income)Sub-Saharan Africa (IDA & IBRD countries)SudanSurinameSwazilandSwedenSwitzerlandSyrian Arab RepublicTajikistanTanzaniaThailandTogoTongaTrinidad and TobagoTunisiaTurkeyTurkmenistanUgandaUkraineUnited Arab EmiratesUnited KingdomUnited StatesUpper middle incomeUruguayUzbekistanVanuatuVenezuela, RBVietnamWorldYemen, Rep.ZambiaZimbabwe Timeline:
This timeline shows a graph from 1971 to 2015 of Central African Republic. No data until 1970. Number of actual observations by date: 45.
Source name:
World Development Indicators
Source organization:
World Bank staff estimates based on sources and methods in World Bank's "The Changing Wealth of Nations: Measuring Sustainable Development in the New Millennium" (2011).
Categories, topics:
Economy & Growth
Last updated:
apr 23, 2017
Indicators value changes by year
Minimum:
164.142 mln
jan 1, 1971
Maximum:
2.057 bln
jan 1, 2012
At the date of observation
Value
Absolute change
Change from previous value
jan 1, 1971
164.142 mln
+164.142 mln
0.0%
jan 1, 1972
172.498 mln
+8.356 mln
5.09%
jan 1, 1973
196.372 mln
+23.874 mln
13.84%
jan 1, 1974
231.332 mln
+34.96 mln
17.8%
jan 1, 1975
236.452 mln
+5.12 mln
2.21%
jan 1, 1976
319.611 mln
+83.158 mln
35.17%
jan 1, 1977
384.789 mln
+65.178 mln
20.39%
jan 1, 1978
439.625 mln
+54.836 mln
14.25%
jan 1, 1979
532.332 mln
+92.707 mln
21.09%
jan 1, 1980
603.172 mln
+70.84 mln
13.31%
jan 1, 1981
690.512 mln
+87.34 mln
14.48%
jan 1, 1982
608.782 mln
-81.73 mln
-11.84%
jan 1, 1983
647.946 mln
+39.164 mln
6.43%
jan 1, 1984
565.038 mln
-82.908 mln
-12.8%
jan 1, 1985
553.957 mln
-11.081 mln
-1.96%
jan 1, 1986
763.435 mln
+209.478 mln
37.81%
jan 1, 1987
990.377 mln
+226.942 mln
29.73%
jan 1, 1988
1.04 bln
+50.046 mln
5.05%
jan 1, 1989
1.095 bln
+54.452 mln
5.23%
jan 1, 1990
1.073 bln
-21.75 mln
-1.99%
jan 1, 1991
1.258 bln
+185.003 mln
17.24%
jan 1, 1992
1.21 bln
-48.252 mln
-3.84%
jan 1, 1993
1.239 bln
+29.136 mln
2.41%
jan 1, 1994
1.117 bln
-122.351 mln
-9.87%
jan 1, 1995
742.084 mln
-374.578 mln
-33.54%
jan 1, 1996
984.418 mln
+242.335 mln
32.66%
jan 1, 1997
872.474 mln
-111.944 mln
-11.37%
jan 1, 1998
826.514 mln
-45.961 mln
-5.27%
jan 1, 1999
857.315 mln
+30.801 mln
3.73%
jan 1, 2000
905.609 mln
+48.294 mln
5.63%
jan 1, 2001
824.195 mln
-81.414 mln
-8.99%
jan 1, 2002
847.015 mln
+22.82 mln
2.77%
jan 1, 2003
901.034 mln
+54.019 mln
6.38%
jan 1, 2004
1.037 bln
+136.16 mln
15.11%
jan 1, 2005
1.151 bln
+114.145 mln
11.01%
jan 1, 2006
1.234 bln
+82.885 mln
7.2%
jan 1, 2007
1.34 bln
+105.751 mln
8.57%
jan 1, 2008
1.565 bln
+225.323 mln
16.82%
jan 1, 2009
1.823 bln
+257.683 mln
16.46%
jan 1, 2010
1.837 bln
+14.513 mln
0.8%
jan 1, 2011
1.86 bln
+22.149 mln
1.21%
jan 1, 2012
2.057 bln
+197.501 mln
10.62%
jan 1, 2013
2.037 bln
-20.258 mln
-0.98%
jan 1, 2014
1.443 bln
-594.189 mln
-29.17%
jan 1, 2015
1.619 bln
+176.512 mln
12.23%
Ranking of countries by current statistics by years


Comments: