29
/
en
AIzaSyAYiBZKx7MnpbEhh9jyipgxe19OcubqV5w
April 1, 2024
138953
Germany
DEU
true
2
1
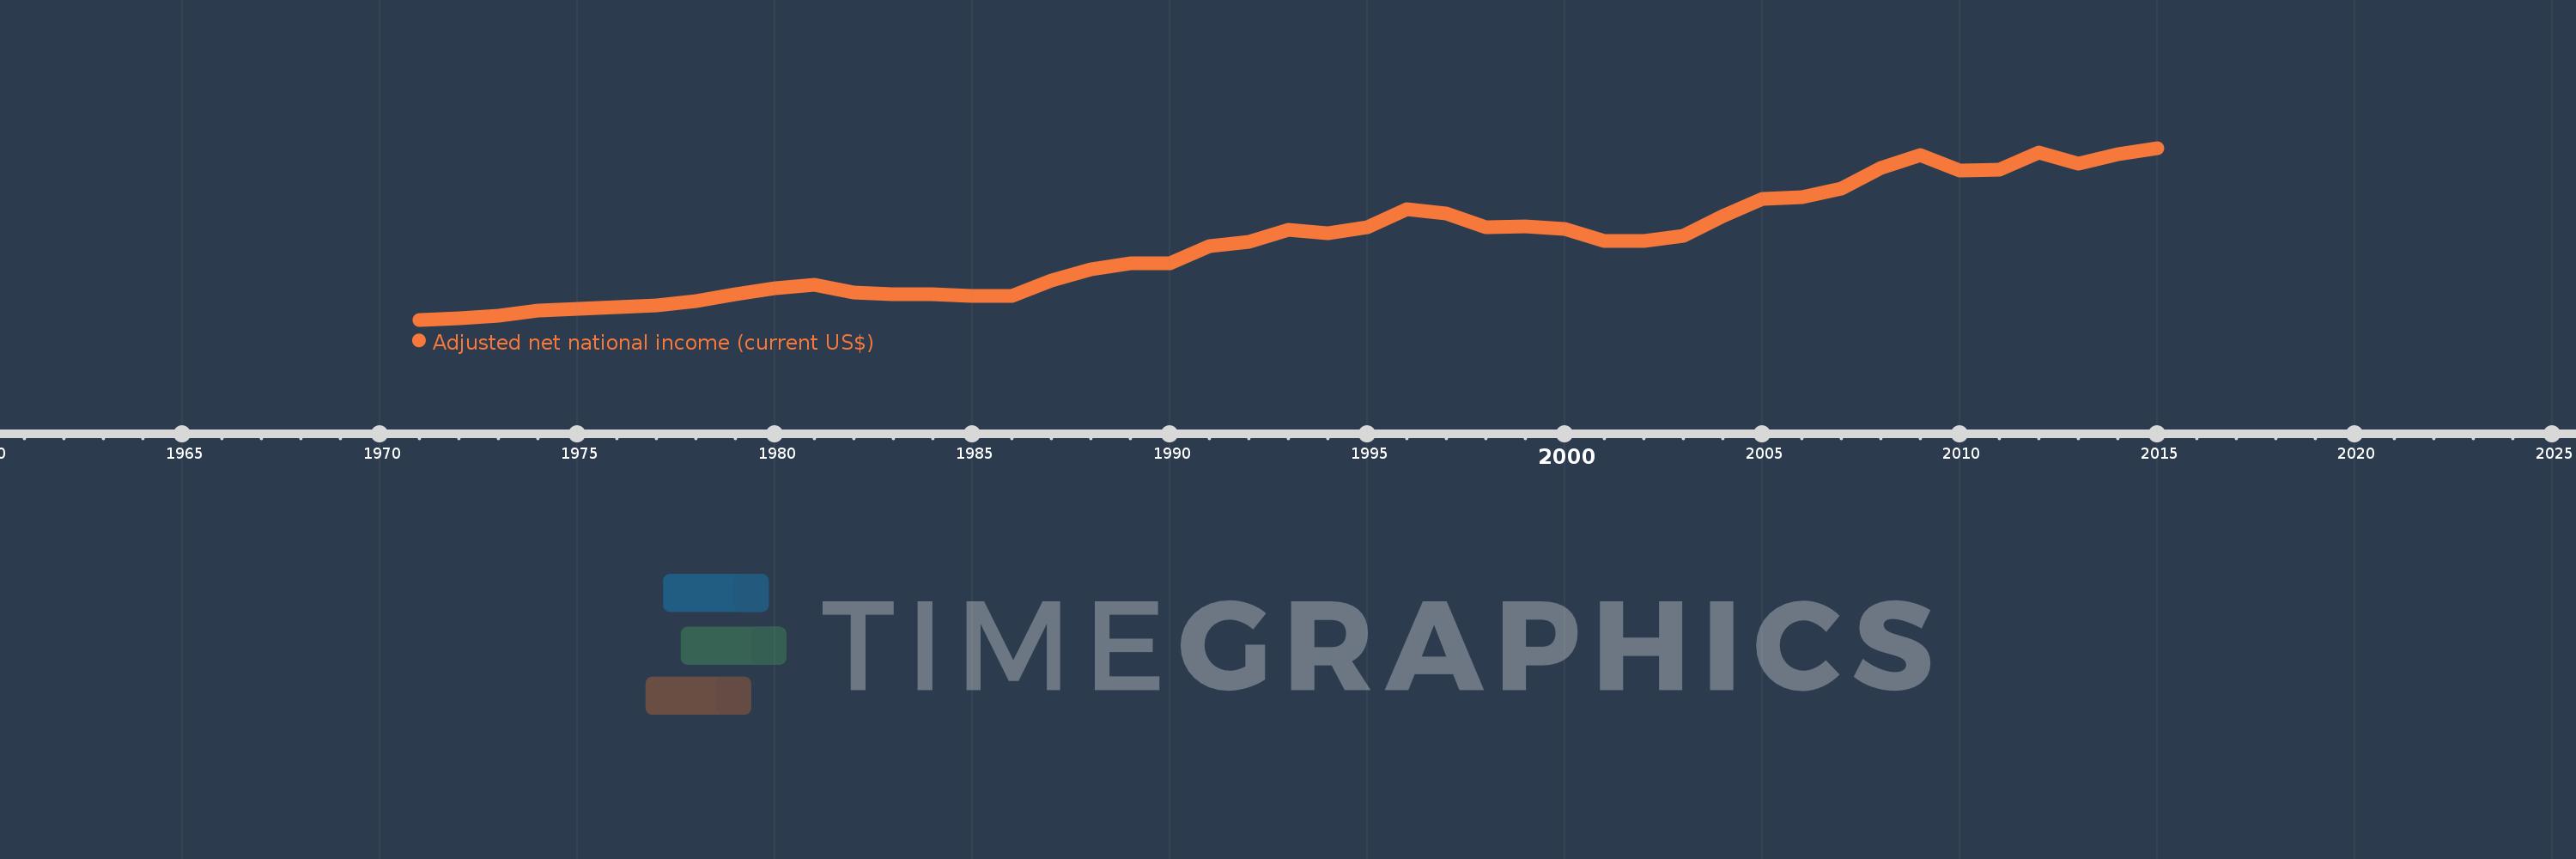
Adjusted net national income (current US$)
2015,2014,2013,2012,2011,2010,2009,2008,2007,2006,2005,2004,2003,2002,2001,2000,1999,1998,1997,1996,1995,1994,1993,1992,1991,1990,1989,1988,1987,1986,1985,1984,1983,1982,1981,1980,1979,1978,1977,1976,1975,1974,1973,1972,1971
This statistics in other country:
AfghanistanAlbaniaAlgeriaAngolaArab WorldArgentinaArmeniaAustraliaAustriaAzerbaijanBahamas, TheBahrainBangladeshBarbadosBelarusBelgiumBelizeBeninBhutanBoliviaBotswanaBrazilBrunei DarussalamBulgariaBurkina FasoBurundiCabo VerdeCambodiaCameroonCanadaCaribbean small statesCentral African RepublicCentral Europe and the BalticsChadChileChinaColombiaComorosCongo, Dem. Rep.Congo, Rep.Costa RicaCote d'IvoireCroatiaCubaCyprusCzech RepublicDenmarkDjiboutiDominicaDominican RepublicEarly-demographic dividendEast Asia & PacificEast Asia & Pacific (excluding high income)East Asia & Pacific (IDA & IBRD countries)EcuadorEgypt, Arab Rep.El SalvadorEquatorial GuineaEritreaEstoniaEthiopiaEuro areaEurope & Central AsiaEurope & Central Asia (excluding high income)Europe & Central Asia (IDA & IBRD countries)European UnionFijiFinlandFragile and conflict affected situationsFranceGabonGambia, TheGeorgiaGermanyGhanaGreeceGuatemalaGuineaGuinea-BissauGuyanaHaitiHeavily indebted poor countries (HIPC)High incomeHondurasHong Kong SAR, ChinaHungaryIBRD onlyIcelandIDA & IBRD totalIDA blendIDA onlyIDA totalIndiaIndonesiaIran, Islamic Rep.IraqIrelandIsraelItalyJamaicaJapanJordanKazakhstanKenyaKiribatiKorea, Rep.KuwaitKyrgyz RepublicLao PDRLate-demographic dividendLatin America & Caribbean Latin America & Caribbean (excluding high income)Latin America & the Caribbean (IDA & IBRD countries)LatviaLeast developed countries: UN classificationLebanonLesothoLiberiaLibyaLithuaniaLow & middle incomeLow incomeLower middle incomeLuxembourgMacedonia, FYRMadagascarMalawiMalaysiaMaldivesMaliMauritaniaMauritiusMexicoMiddle East & North AfricaMiddle East & North Africa (excluding high income)Middle East & North Africa (IDA & IBRD countries)Middle incomeMoldovaMongoliaMoroccoMozambiqueMyanmarNamibiaNepalNetherlandsNew ZealandNicaraguaNigerNigeriaNorth AmericaNorwayOECD membersOmanOther small statesPacific island small statesPakistanPanamaPapua New GuineaParaguayPeruPhilippinesPolandPortugalPost-demographic dividendPre-demographic dividendQatarRomaniaRussian FederationRwandaSamoaSao Tome and PrincipeSaudi ArabiaSenegalSeychellesSierra LeoneSingaporeSlovak RepublicSloveniaSmall statesSolomon IslandsSouth AfricaSouth AsiaSouth Asia (IDA & IBRD)SpainSri LankaSt. LuciaSt. Vincent and the GrenadinesSub-Saharan Africa Sub-Saharan Africa (excluding high income)Sub-Saharan Africa (IDA & IBRD countries)SudanSurinameSwazilandSwedenSwitzerlandSyrian Arab RepublicTajikistanTanzaniaThailandTogoTongaTrinidad and TobagoTunisiaTurkeyTurkmenistanUgandaUkraineUnited Arab EmiratesUnited KingdomUnited StatesUpper middle incomeUruguayUzbekistanVanuatuVenezuela, RBVietnamWorldYemen, Rep.ZambiaZimbabwe Timeline:
This timeline shows a graph from 1971 to 2015 of Germany. No data until 1970. Number of actual observations by date: 45.
Source name:
World Development Indicators
Source organization:
World Bank staff estimates based on sources and methods in World Bank's "The Changing Wealth of Nations: Measuring Sustainable Development in the New Millennium" (2011).
Categories, topics:
Economy & Growth
Last updated:
apr 23, 2017
Indicators value changes by year
Minimum:
189.938 bln
jan 1, 1971
Maximum:
3.268 trl
jan 1, 2015
At the date of observation
Value
Absolute change
Change from previous value
jan 1, 1971
189.938 bln
+189.938 bln
0.0%
jan 1, 1972
218.609 bln
+28.67 bln
15.09%
jan 1, 1973
261.348 bln
+42.739 bln
19.55%
jan 1, 1974
347.474 bln
+86.126 bln
32.95%
jan 1, 1975
385.415 bln
+37.941 bln
10.92%
jan 1, 1976
422.627 bln
+37.212 bln
9.65%
jan 1, 1977
449.184 bln
+26.557 bln
6.28%
jan 1, 1978
518.152 bln
+68.967 bln
15.35%
jan 1, 1979
640.645 bln
+122.494 bln
23.64%
jan 1, 1980
758.164 bln
+117.519 bln
18.34%
jan 1, 1981
811.607 bln
+53.443 bln
7.05%
jan 1, 1982
675.51 bln
-136.098 bln
-16.77%
jan 1, 1983
651.494 bln
-24.015 bln
-3.56%
jan 1, 1984
650.281 bln
-1.213 bln
-0.19%
jan 1, 1985
614.333 bln
-35.948 bln
-5.53%
jan 1, 1986
620.878 bln
+6.544 bln
1.07%
jan 1, 1987
888.255 bln
+267.377 bln
43.06%
jan 1, 1988
1.099 trl
+210.364 bln
23.68%
jan 1, 1989
1.195 trl
+96.282 bln
8.76%
jan 1, 1990
1.196 trl
+1.199 bln
0.1%
jan 1, 1991
1.516 trl
+319.462 bln
26.71%
jan 1, 1992
1.587 trl
+71.778 bln
4.74%
jan 1, 1993
1.805 trl
+217.423 bln
13.7%
jan 1, 1994
1.74 trl
-64.929 bln
-3.6%
jan 1, 1995
1.85 trl
+109.69 bln
6.3%
jan 1, 1996
2.166 trl
+316.411 bln
17.11%
jan 1, 1997
2.09 trl
-75.542 bln
-3.49%
jan 1, 1998
1.846 trl
-244.201 bln
-11.68%
jan 1, 1999
1.859 trl
+13.076 bln
0.71%
jan 1, 2000
1.819 trl
-40.596 bln
-2.18%
jan 1, 2001
1.608 trl
-210.294 bln
-11.56%
jan 1, 2002
1.604 trl
-3.969 bln
-0.25%
jan 1, 2003
1.7 trl
+95.705 bln
5.97%
jan 1, 2004
2.053 trl
+352.956 bln
20.76%
jan 1, 2005
2.357 trl
+303.848 bln
14.8%
jan 1, 2006
2.394 trl
+37.079 bln
1.57%
jan 1, 2007
2.544 trl
+150.227 bln
6.28%
jan 1, 2008
2.907 trl
+362.324 bln
14.24%
jan 1, 2009
3.136 trl
+229.366 bln
7.89%
jan 1, 2010
2.866 trl
-270.294 bln
-8.62%
jan 1, 2011
2.873 trl
+7.098 bln
0.25%
jan 1, 2012
3.187 trl
+314.399 bln
10.94%
jan 1, 2013
2.989 trl
-198.466 bln
-6.23%
jan 1, 2014
3.153 trl
+164.843 bln
5.52%
jan 1, 2015
3.268 trl
+114.899 bln
3.64%
Ranking of countries by current statistics by years


Comments: