29
/
en
AIzaSyAYiBZKx7MnpbEhh9jyipgxe19OcubqV5w
April 1, 2024
131649
Fiji
FJI
true
2
1
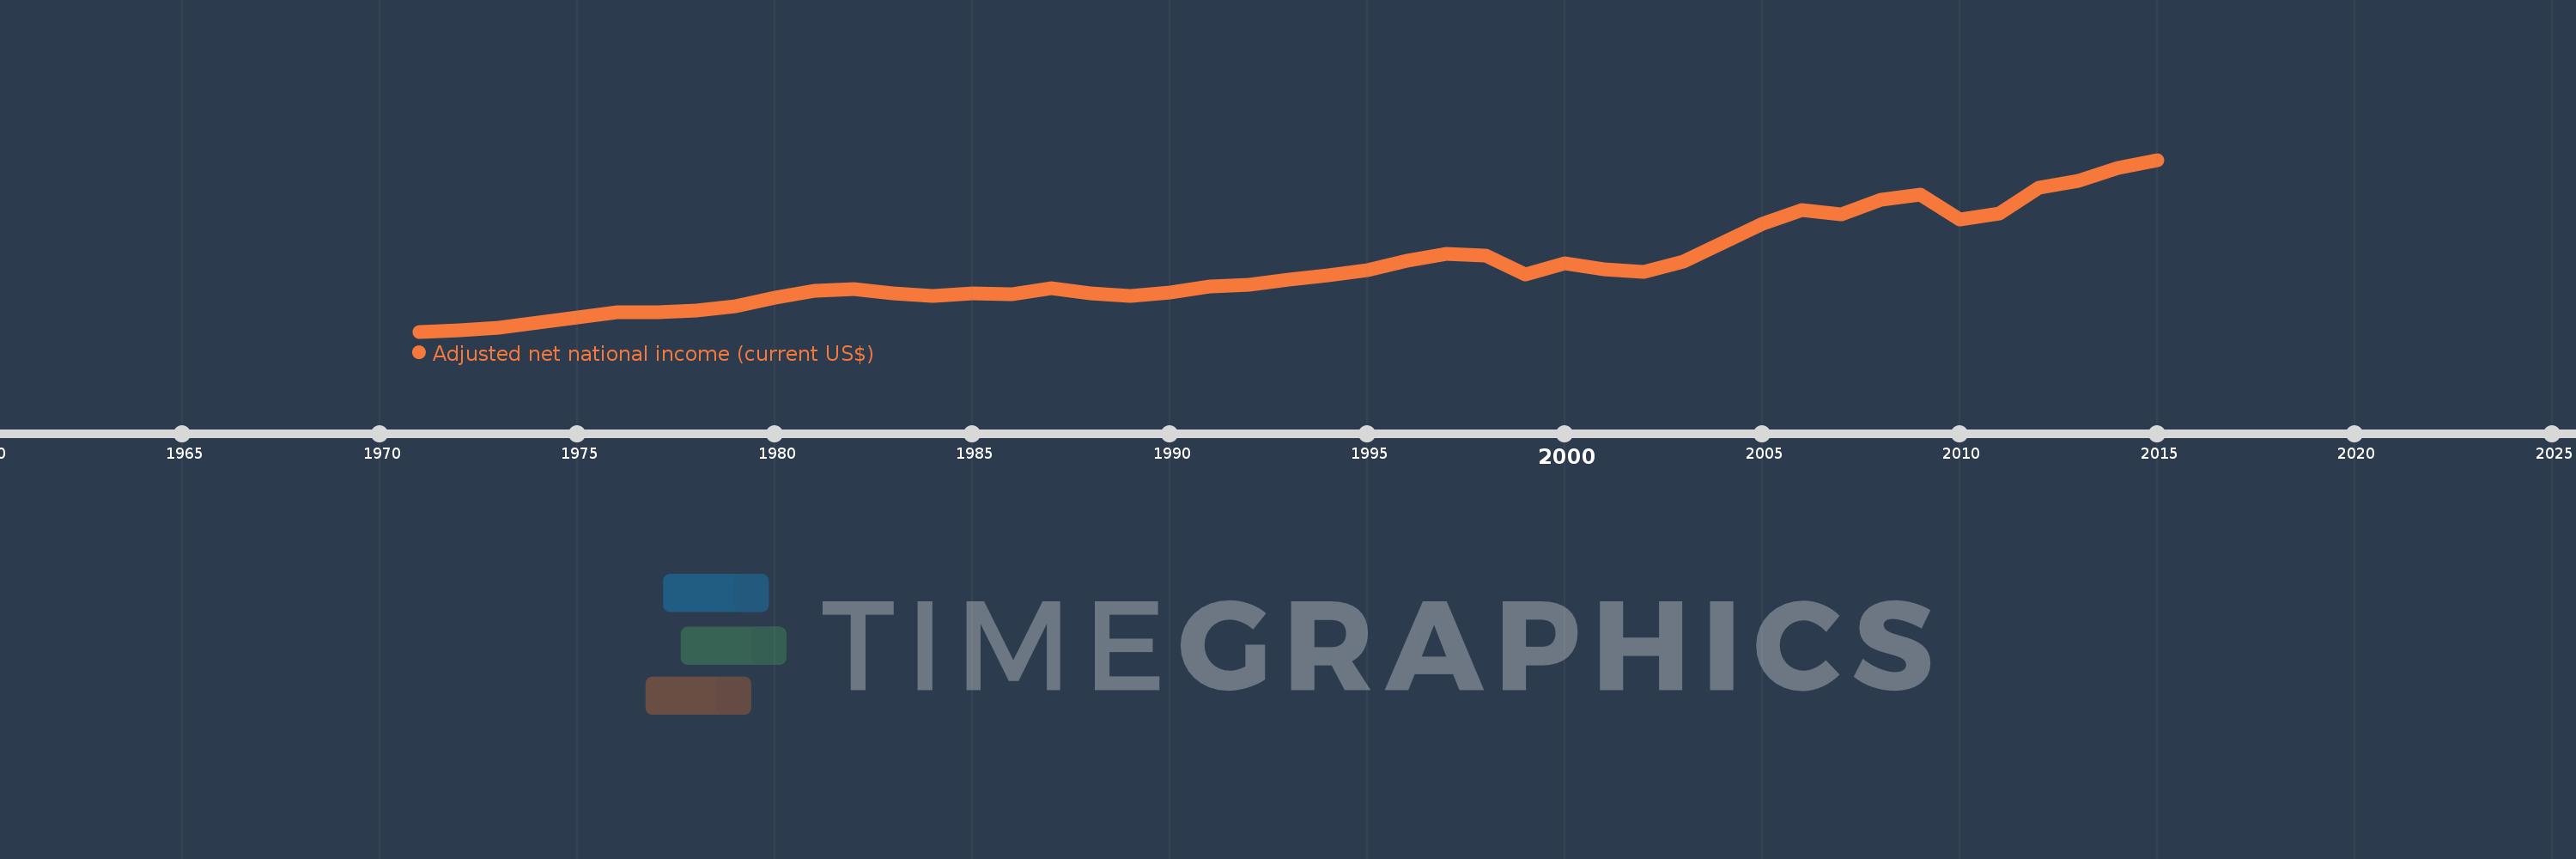
Adjusted net national income (current US$)
2015,2014,2013,2012,2011,2010,2009,2008,2007,2006,2005,2004,2003,2002,2001,2000,1999,1998,1997,1996,1995,1994,1993,1992,1991,1990,1989,1988,1987,1986,1985,1984,1983,1982,1981,1980,1979,1978,1977,1976,1975,1974,1973,1972,1971
This statistics in other country:
AfghanistanAlbaniaAlgeriaAngolaArab WorldArgentinaArmeniaAustraliaAustriaAzerbaijanBahamas, TheBahrainBangladeshBarbadosBelarusBelgiumBelizeBeninBhutanBoliviaBotswanaBrazilBrunei DarussalamBulgariaBurkina FasoBurundiCabo VerdeCambodiaCameroonCanadaCaribbean small statesCentral African RepublicCentral Europe and the BalticsChadChileChinaColombiaComorosCongo, Dem. Rep.Congo, Rep.Costa RicaCote d'IvoireCroatiaCubaCyprusCzech RepublicDenmarkDjiboutiDominicaDominican RepublicEarly-demographic dividendEast Asia & PacificEast Asia & Pacific (excluding high income)East Asia & Pacific (IDA & IBRD countries)EcuadorEgypt, Arab Rep.El SalvadorEquatorial GuineaEritreaEstoniaEthiopiaEuro areaEurope & Central AsiaEurope & Central Asia (excluding high income)Europe & Central Asia (IDA & IBRD countries)European UnionFijiFinlandFragile and conflict affected situationsFranceGabonGambia, TheGeorgiaGermanyGhanaGreeceGuatemalaGuineaGuinea-BissauGuyanaHaitiHeavily indebted poor countries (HIPC)High incomeHondurasHong Kong SAR, ChinaHungaryIBRD onlyIcelandIDA & IBRD totalIDA blendIDA onlyIDA totalIndiaIndonesiaIran, Islamic Rep.IraqIrelandIsraelItalyJamaicaJapanJordanKazakhstanKenyaKiribatiKorea, Rep.KuwaitKyrgyz RepublicLao PDRLate-demographic dividendLatin America & Caribbean Latin America & Caribbean (excluding high income)Latin America & the Caribbean (IDA & IBRD countries)LatviaLeast developed countries: UN classificationLebanonLesothoLiberiaLibyaLithuaniaLow & middle incomeLow incomeLower middle incomeLuxembourgMacedonia, FYRMadagascarMalawiMalaysiaMaldivesMaliMauritaniaMauritiusMexicoMiddle East & North AfricaMiddle East & North Africa (excluding high income)Middle East & North Africa (IDA & IBRD countries)Middle incomeMoldovaMongoliaMoroccoMozambiqueMyanmarNamibiaNepalNetherlandsNew ZealandNicaraguaNigerNigeriaNorth AmericaNorwayOECD membersOmanOther small statesPacific island small statesPakistanPanamaPapua New GuineaParaguayPeruPhilippinesPolandPortugalPost-demographic dividendPre-demographic dividendQatarRomaniaRussian FederationRwandaSamoaSao Tome and PrincipeSaudi ArabiaSenegalSeychellesSierra LeoneSingaporeSlovak RepublicSloveniaSmall statesSolomon IslandsSouth AfricaSouth AsiaSouth Asia (IDA & IBRD)SpainSri LankaSt. LuciaSt. Vincent and the GrenadinesSub-Saharan Africa Sub-Saharan Africa (excluding high income)Sub-Saharan Africa (IDA & IBRD countries)SudanSurinameSwazilandSwedenSwitzerlandSyrian Arab RepublicTajikistanTanzaniaThailandTogoTongaTrinidad and TobagoTunisiaTurkeyTurkmenistanUgandaUkraineUnited Arab EmiratesUnited KingdomUnited StatesUpper middle incomeUruguayUzbekistanVanuatuVenezuela, RBVietnamWorldYemen, Rep.ZambiaZimbabwe Timeline:
This timeline shows a graph from 1971 to 2015 of Fiji. No data until 1970. Number of actual observations by date: 45.
Source name:
World Development Indicators
Source organization:
World Bank staff estimates based on sources and methods in World Bank's "The Changing Wealth of Nations: Measuring Sustainable Development in the New Millennium" (2011).
Categories, topics:
Economy & Growth
Last updated:
apr 23, 2017
Indicators value changes by year
Minimum:
187.496 mln
jan 1, 1971
Maximum:
3.848 bln
jan 1, 2015
At the date of observation
Value
Absolute change
Change from previous value
jan 1, 1971
187.496 mln
+187.496 mln
0.0%
jan 1, 1972
210.58 mln
+23.084 mln
12.31%
jan 1, 1973
273.141 mln
+62.561 mln
29.71%
jan 1, 1974
377.033 mln
+103.892 mln
38.04%
jan 1, 1975
495.27 mln
+118.238 mln
31.36%
jan 1, 1976
594.791 mln
+99.52 mln
20.09%
jan 1, 1977
607.985 mln
+13.195 mln
2.22%
jan 1, 1978
633.097 mln
+25.111 mln
4.13%
jan 1, 1979
734.3 mln
+101.204 mln
15.99%
jan 1, 1980
903.424 mln
+169.123 mln
23.03%
jan 1, 1981
1.051 bln
+147.43 mln
16.32%
jan 1, 1982
1.087 bln
+35.875 mln
3.41%
jan 1, 1983
1.008 bln
-79.083 mln
-7.28%
jan 1, 1984
944.851 mln
-62.795 mln
-6.23%
jan 1, 1985
1.001 bln
+56.177 mln
5.95%
jan 1, 1986
981.292 mln
-19.735 mln
-1.97%
jan 1, 1987
1.117 bln
+135.709 mln
13.83%
jan 1, 1988
1.001 bln
-116.242 mln
-10.41%
jan 1, 1989
941.818 mln
-58.941 mln
-5.89%
jan 1, 1990
1.021 bln
+79.218 mln
8.41%
jan 1, 1991
1.142 bln
+121.277 mln
11.88%
jan 1, 1992
1.176 bln
+33.719 mln
2.95%
jan 1, 1993
1.293 bln
+116.898 mln
9.94%
jan 1, 1994
1.382 bln
+88.634 mln
6.86%
jan 1, 1995
1.503 bln
+121.458 mln
8.79%
jan 1, 1996
1.689 bln
+185.747 mln
12.36%
jan 1, 1997
1.838 bln
+149.046 mln
8.83%
jan 1, 1998
1.811 bln
-26.78 mln
-1.46%
jan 1, 1999
1.413 bln
-398.001 mln
-21.98%
jan 1, 2000
1.649 bln
+235.806 mln
16.69%
jan 1, 2001
1.513 bln
-136.015 mln
-8.25%
jan 1, 2002
1.463 bln
-49.658 mln
-3.28%
jan 1, 2003
1.681 bln
+217.57 mln
14.87%
jan 1, 2004
2.08 bln
+399.013 mln
23.74%
jan 1, 2005
2.476 bln
+396.566 mln
19.07%
jan 1, 2006
2.768 bln
+291.899 mln
11.79%
jan 1, 2007
2.691 bln
-77.62 mln
-2.8%
jan 1, 2008
3.002 bln
+311.514 mln
11.58%
jan 1, 2009
3.107 bln
+104.464 mln
3.48%
jan 1, 2010
2.571 bln
-536.065 mln
-17.26%
jan 1, 2011
2.703 bln
+132.989 mln
5.17%
jan 1, 2012
3.251 bln
+547.092 mln
20.24%
jan 1, 2013
3.393 bln
+142.899 mln
4.4%
jan 1, 2014
3.667 bln
+273.845 mln
8.07%
jan 1, 2015
3.848 bln
+180.329 mln
4.92%
Ranking of countries by current statistics by years


Comments: