29
/
en
AIzaSyAYiBZKx7MnpbEhh9jyipgxe19OcubqV5w
April 1, 2024
54526
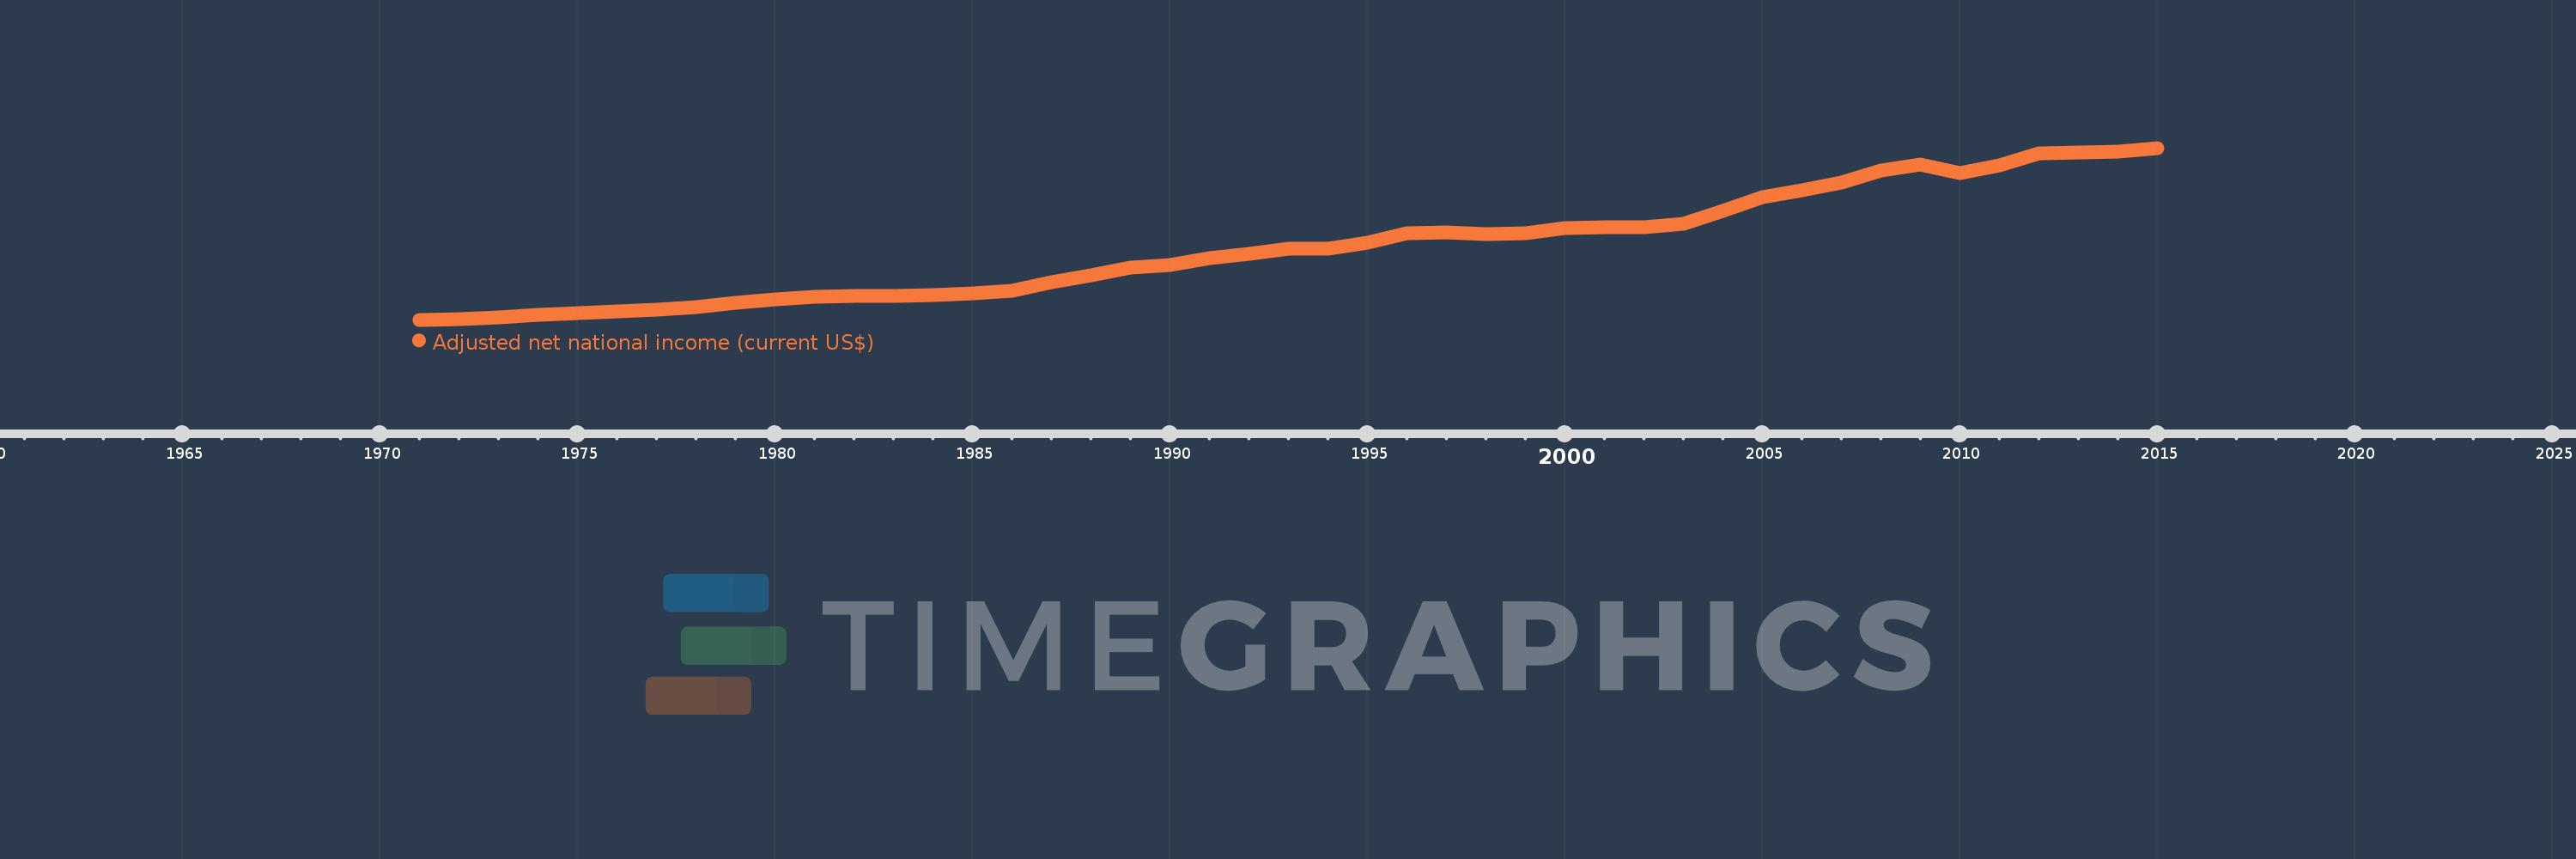
Post-demographic dividend
PST
false
2
1
Adjusted net national income (current US$)
2015,2014,2013,2012,2011,2010,2009,2008,2007,2006,2005,2004,2003,2002,2001,2000,1999,1998,1997,1996,1995,1994,1993,1992,1991,1990,1989,1988,1987,1986,1985,1984,1983,1982,1981,1980,1979,1978,1977,1976,1975,1974,1973,1972,1971
This statistics in other country:
AfghanistanAlbaniaAlgeriaAngolaArab WorldArgentinaArmeniaAustraliaAustriaAzerbaijanBahamas, TheBahrainBangladeshBarbadosBelarusBelgiumBelizeBeninBhutanBoliviaBotswanaBrazilBrunei DarussalamBulgariaBurkina FasoBurundiCabo VerdeCambodiaCameroonCanadaCaribbean small statesCentral African RepublicCentral Europe and the BalticsChadChileChinaColombiaComorosCongo, Dem. Rep.Congo, Rep.Costa RicaCote d'IvoireCroatiaCubaCyprusCzech RepublicDenmarkDjiboutiDominicaDominican RepublicEarly-demographic dividendEast Asia & PacificEast Asia & Pacific (excluding high income)East Asia & Pacific (IDA & IBRD countries)EcuadorEgypt, Arab Rep.El SalvadorEquatorial GuineaEritreaEstoniaEthiopiaEuro areaEurope & Central AsiaEurope & Central Asia (excluding high income)Europe & Central Asia (IDA & IBRD countries)European UnionFijiFinlandFragile and conflict affected situationsFranceGabonGambia, TheGeorgiaGermanyGhanaGreeceGuatemalaGuineaGuinea-BissauGuyanaHaitiHeavily indebted poor countries (HIPC)High incomeHondurasHong Kong SAR, ChinaHungaryIBRD onlyIcelandIDA & IBRD totalIDA blendIDA onlyIDA totalIndiaIndonesiaIran, Islamic Rep.IraqIrelandIsraelItalyJamaicaJapanJordanKazakhstanKenyaKiribatiKorea, Rep.KuwaitKyrgyz RepublicLao PDRLate-demographic dividendLatin America & Caribbean Latin America & Caribbean (excluding high income)Latin America & the Caribbean (IDA & IBRD countries)LatviaLeast developed countries: UN classificationLebanonLesothoLiberiaLibyaLithuaniaLow & middle incomeLow incomeLower middle incomeLuxembourgMacedonia, FYRMadagascarMalawiMalaysiaMaldivesMaliMauritaniaMauritiusMexicoMiddle East & North AfricaMiddle East & North Africa (excluding high income)Middle East & North Africa (IDA & IBRD countries)Middle incomeMoldovaMongoliaMoroccoMozambiqueMyanmarNamibiaNepalNetherlandsNew ZealandNicaraguaNigerNigeriaNorth AmericaNorwayOECD membersOmanOther small statesPacific island small statesPakistanPanamaPapua New GuineaParaguayPeruPhilippinesPolandPortugalPost-demographic dividendPre-demographic dividendQatarRomaniaRussian FederationRwandaSamoaSao Tome and PrincipeSaudi ArabiaSenegalSeychellesSierra LeoneSingaporeSlovak RepublicSloveniaSmall statesSolomon IslandsSouth AfricaSouth AsiaSouth Asia (IDA & IBRD)SpainSri LankaSt. LuciaSt. Vincent and the GrenadinesSub-Saharan Africa Sub-Saharan Africa (excluding high income)Sub-Saharan Africa (IDA & IBRD countries)SudanSurinameSwazilandSwedenSwitzerlandSyrian Arab RepublicTajikistanTanzaniaThailandTogoTongaTrinidad and TobagoTunisiaTurkeyTurkmenistanUgandaUkraineUnited Arab EmiratesUnited KingdomUnited StatesUpper middle incomeUruguayUzbekistanVanuatuVenezuela, RBVietnamWorldYemen, Rep.ZambiaZimbabwe Timeline:
This timeline shows a graph from 1971 to 2015 of Post-demographic dividend. No data until 1970. Number of actual observations by date: 45.
Source name:
World Development Indicators
Source organization:
World Bank staff estimates based on sources and methods in World Bank's "The Changing Wealth of Nations: Measuring Sustainable Development in the New Millennium" (2011).
Categories, topics:
Economy & Growth
Last updated:
apr 23, 2017
Indicators value changes by year
Minimum:
2.029 trl
jan 1, 1971
Maximum:
38.687 trl
jan 1, 2015
At the date of observation
Value
Absolute change
Change from previous value
jan 1, 1971
2.029 trl
+2.029 trl
0.0%
jan 1, 1972
2.241 trl
+212.135 bln
10.45%
jan 1, 1973
2.601 trl
+359.498 bln
16.04%
jan 1, 1974
3.136 trl
+534.997 bln
20.57%
jan 1, 1975
3.435 trl
+299.246 bln
9.54%
jan 1, 1976
3.833 trl
+397.707 bln
11.58%
jan 1, 1977
4.161 trl
+327.812 bln
8.55%
jan 1, 1978
4.696 trl
+535.016 bln
12.86%
jan 1, 1979
5.647 trl
+951.224 bln
20.26%
jan 1, 1980
6.384 trl
+737.722 bln
13.06%
jan 1, 1981
7.006 trl
+621.978 bln
9.74%
jan 1, 1982
7.067 trl
+60.632 bln
0.87%
jan 1, 1983
7.048 trl
-18.929 bln
-0.27%
jan 1, 1984
7.331 trl
+282.836 bln
4.01%
jan 1, 1985
7.724 trl
+392.715 bln
5.36%
jan 1, 1986
8.146 trl
+422.632 bln
5.47%
jan 1, 1987
9.986 trl
+1.84 trl
22.59%
jan 1, 1988
11.593 trl
+1.606 trl
16.09%
jan 1, 1989
13.133 trl
+1.54 trl
13.29%
jan 1, 1990
13.637 trl
+503.779 bln
3.84%
jan 1, 1991
15.228 trl
+1.591 trl
11.67%
jan 1, 1992
16.027 trl
+799.582 bln
5.25%
jan 1, 1993
17.191 trl
+1.164 trl
7.26%
jan 1, 1994
17.24 trl
+49.455 bln
0.29%
jan 1, 1995
18.491 trl
+1.25 trl
7.25%
jan 1, 1996
20.466 trl
+1.975 trl
10.68%
jan 1, 1997
20.622 trl
+156.58 bln
0.77%
jan 1, 1998
20.348 trl
-274.522 bln
-1.33%
jan 1, 1999
20.531 trl
+182.98 bln
0.9%
jan 1, 2000
21.526 trl
+994.961 bln
4.85%
jan 1, 2001
21.856 trl
+330.112 bln
1.53%
jan 1, 2002
21.682 trl
-173.552 bln
-0.79%
jan 1, 2003
22.587 trl
+904.562 bln
4.17%
jan 1, 2004
25.332 trl
+2.745 trl
12.15%
jan 1, 2005
28.224 trl
+2.892 trl
11.42%
jan 1, 2006
29.625 trl
+1.401 trl
4.96%
jan 1, 2007
31.286 trl
+1.661 trl
5.61%
jan 1, 2008
33.852 trl
+2.566 trl
8.2%
jan 1, 2009
35.21 trl
+1.358 trl
4.01%
jan 1, 2010
33.256 trl
-1.954 trl
-5.55%
jan 1, 2011
34.984 trl
+1.728 trl
5.2%
jan 1, 2012
37.595 trl
+2.611 trl
7.46%
jan 1, 2013
37.722 trl
+127.107 bln
0.34%
jan 1, 2014
37.962 trl
+240.414 bln
0.64%
jan 1, 2015
38.687 trl
+725.039 bln
1.91%
Ranking of countries by current statistics by years


Comments: