29
/
en
AIzaSyAYiBZKx7MnpbEhh9jyipgxe19OcubqV5w
April 1, 2024
284239
Yemen, Rep.
YEM
true
2
1
Adjusted net national income (current US$)
2014,2013,2012,2011,2010,2009,2008,2007,2006,2005,2004,2003,2002,2001,2000,1999,1998,1997,1996,1995,1994,1993,1992,1991
This statistics in other country:
AfghanistanAlbaniaAlgeriaAngolaArab WorldArgentinaArmeniaAustraliaAustriaAzerbaijanBahamas, TheBahrainBangladeshBarbadosBelarusBelgiumBelizeBeninBhutanBoliviaBotswanaBrazilBrunei DarussalamBulgariaBurkina FasoBurundiCabo VerdeCambodiaCameroonCanadaCaribbean small statesCentral African RepublicCentral Europe and the BalticsChadChileChinaColombiaComorosCongo, Dem. Rep.Congo, Rep.Costa RicaCote d'IvoireCroatiaCubaCyprusCzech RepublicDenmarkDjiboutiDominicaDominican RepublicEarly-demographic dividendEast Asia & PacificEast Asia & Pacific (excluding high income)East Asia & Pacific (IDA & IBRD countries)EcuadorEgypt, Arab Rep.El SalvadorEquatorial GuineaEritreaEstoniaEthiopiaEuro areaEurope & Central AsiaEurope & Central Asia (excluding high income)Europe & Central Asia (IDA & IBRD countries)European UnionFijiFinlandFragile and conflict affected situationsFranceGabonGambia, TheGeorgiaGermanyGhanaGreeceGuatemalaGuineaGuinea-BissauGuyanaHaitiHeavily indebted poor countries (HIPC)High incomeHondurasHong Kong SAR, ChinaHungaryIBRD onlyIcelandIDA & IBRD totalIDA blendIDA onlyIDA totalIndiaIndonesiaIran, Islamic Rep.IraqIrelandIsraelItalyJamaicaJapanJordanKazakhstanKenyaKiribatiKorea, Rep.KuwaitKyrgyz RepublicLao PDRLate-demographic dividendLatin America & Caribbean Latin America & Caribbean (excluding high income)Latin America & the Caribbean (IDA & IBRD countries)LatviaLeast developed countries: UN classificationLebanonLesothoLiberiaLibyaLithuaniaLow & middle incomeLow incomeLower middle incomeLuxembourgMacedonia, FYRMadagascarMalawiMalaysiaMaldivesMaliMauritaniaMauritiusMexicoMiddle East & North AfricaMiddle East & North Africa (excluding high income)Middle East & North Africa (IDA & IBRD countries)Middle incomeMoldovaMongoliaMoroccoMozambiqueMyanmarNamibiaNepalNetherlandsNew ZealandNicaraguaNigerNigeriaNorth AmericaNorwayOECD membersOmanOther small statesPacific island small statesPakistanPanamaPapua New GuineaParaguayPeruPhilippinesPolandPortugalPost-demographic dividendPre-demographic dividendQatarRomaniaRussian FederationRwandaSamoaSao Tome and PrincipeSaudi ArabiaSenegalSeychellesSierra LeoneSingaporeSlovak RepublicSloveniaSmall statesSolomon IslandsSouth AfricaSouth AsiaSouth Asia (IDA & IBRD)SpainSri LankaSt. LuciaSt. Vincent and the GrenadinesSub-Saharan Africa Sub-Saharan Africa (excluding high income)Sub-Saharan Africa (IDA & IBRD countries)SudanSurinameSwazilandSwedenSwitzerlandSyrian Arab RepublicTajikistanTanzaniaThailandTogoTongaTrinidad and TobagoTunisiaTurkeyTurkmenistanUgandaUkraineUnited Arab EmiratesUnited KingdomUnited StatesUpper middle incomeUruguayUzbekistanVanuatuVenezuela, RBVietnamWorldYemen, Rep.ZambiaZimbabwe Timeline:
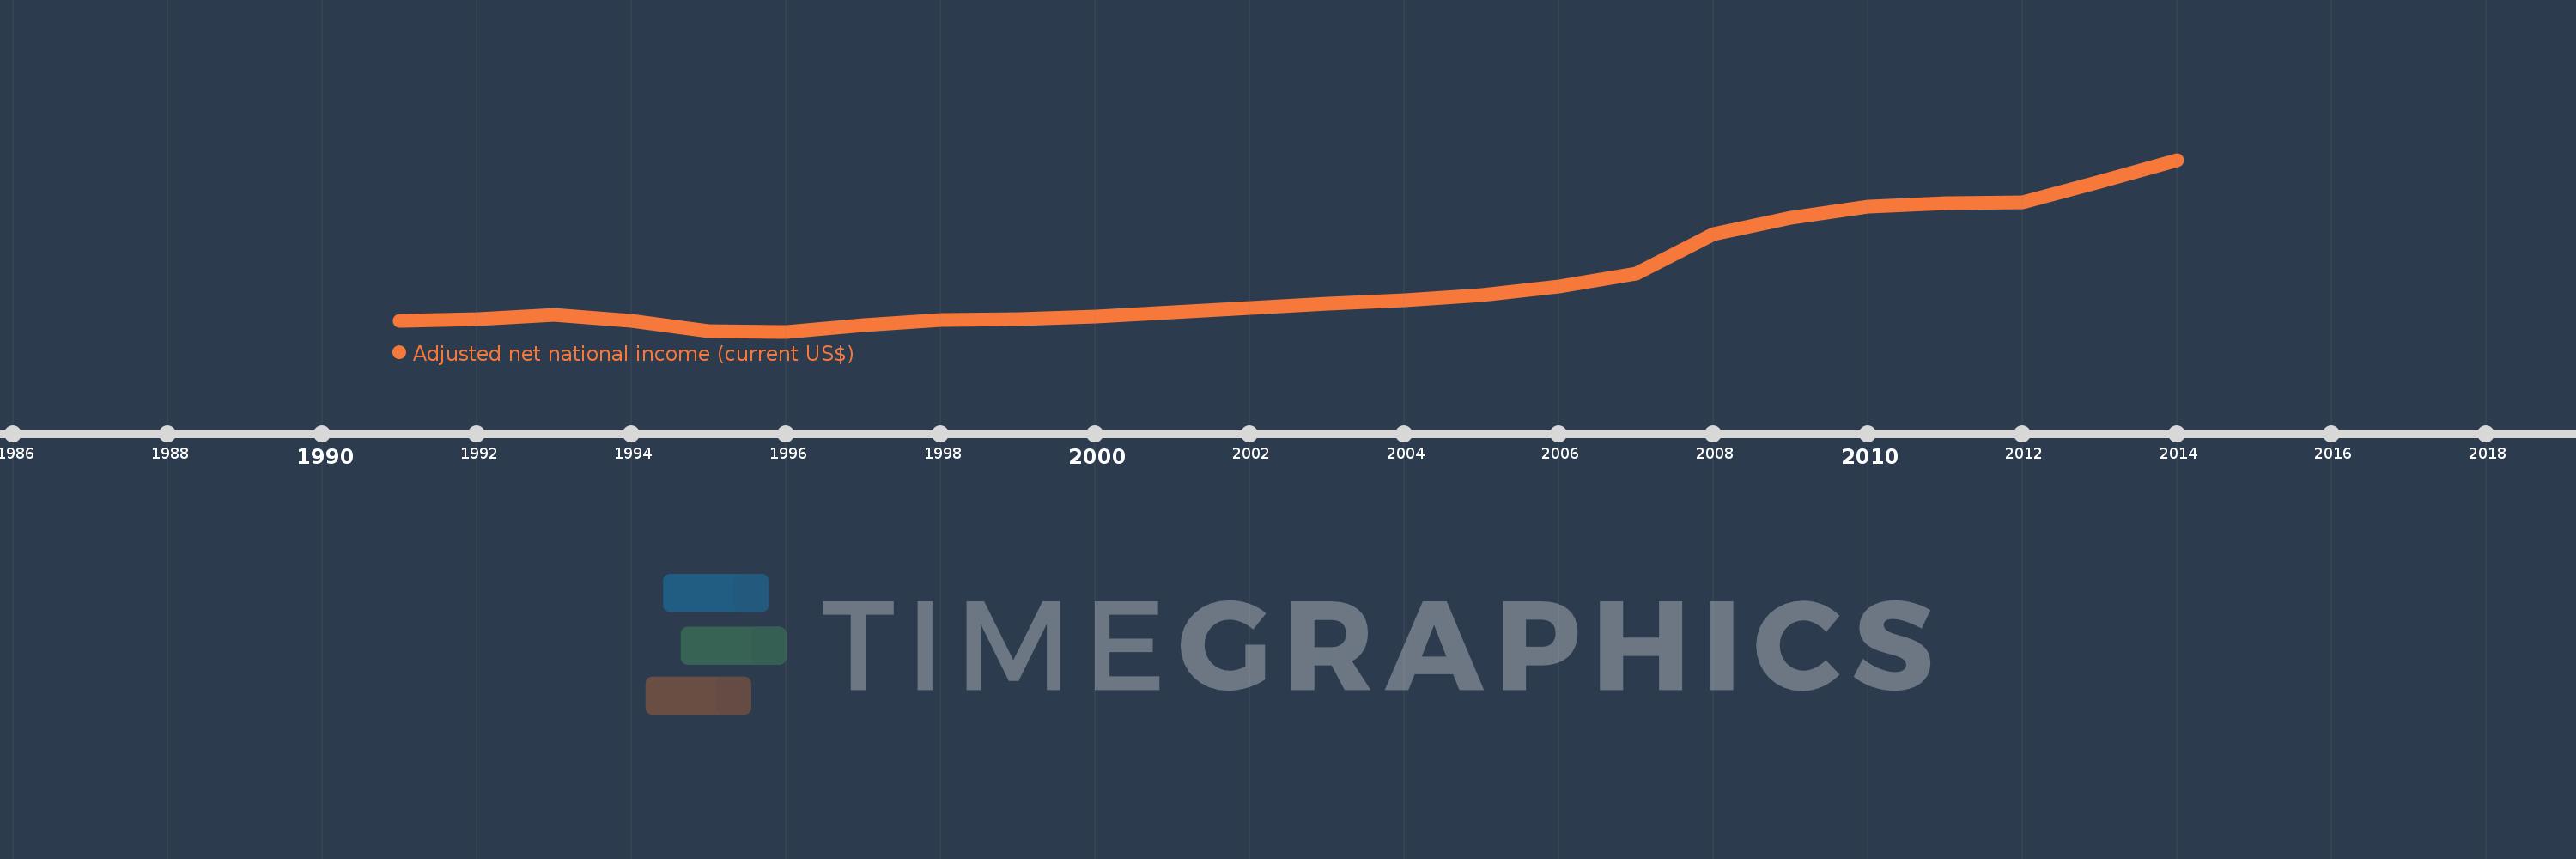
This timeline shows a graph from 1991 to 2014 of Yemen, Rep.. No data until 1990. Number of actual observations by date: 24.
Source name:
World Development Indicators
Source organization:
World Bank staff estimates based on sources and methods in World Bank's "The Changing Wealth of Nations: Measuring Sustainable Development in the New Millennium" (2011).
Categories, topics:
Economy & Growth
Last updated:
apr 23, 2017
Indicators value changes by year
Minimum:
2.88 bln
jan 1, 1996
Maximum:
29.698 bln
jan 1, 2014
At the date of observation
Value
Absolute change
Change from previous value
jan 1, 1991
4.616 bln
+4.616 bln
0.0%
jan 1, 1992
4.845 bln
+229.224 mln
4.97%
jan 1, 1993
5.496 bln
+651.068 mln
13.44%
jan 1, 1994
4.497 bln
-999.678 mln
-18.19%
jan 1, 1995
2.987 bln
-1.51 bln
-33.57%
jan 1, 1996
2.88 bln
-107.372 mln
-3.59%
jan 1, 1997
3.859 bln
+979.134 mln
34.0%
jan 1, 1998
4.715 bln
+855.973 mln
22.18%
jan 1, 1999
4.87 bln
+155.479 mln
3.3%
jan 1, 2000
5.26 bln
+390.122 mln
8.01%
jan 1, 2001
5.854 bln
+593.456 mln
11.28%
jan 1, 2002
6.583 bln
+729.124 mln
12.46%
jan 1, 2003
7.223 bln
+640.214 mln
9.73%
jan 1, 2004
7.729 bln
+506.089 mln
7.01%
jan 1, 2005
8.606 bln
+876.439 mln
11.34%
jan 1, 2006
9.891 bln
+1.285 bln
14.94%
jan 1, 2007
11.989 bln
+2.099 bln
21.22%
jan 1, 2008
18.043 bln
+6.054 bln
50.49%
jan 1, 2009
20.714 bln
+2.671 bln
14.8%
jan 1, 2010
22.357 bln
+1.643 bln
7.93%
jan 1, 2011
22.88 bln
+522.718 mln
2.34%
jan 1, 2012
23.001 bln
+121.364 mln
0.53%
jan 1, 2013
26.33 bln
+3.329 bln
14.47%
jan 1, 2014
29.698 bln
+3.368 bln
12.79%
Ranking of countries by current statistics by years


Comments: