29
/
en
AIzaSyAYiBZKx7MnpbEhh9jyipgxe19OcubqV5w
April 1, 2024
113179
Cote d'Ivoire
CIV
true
2
1
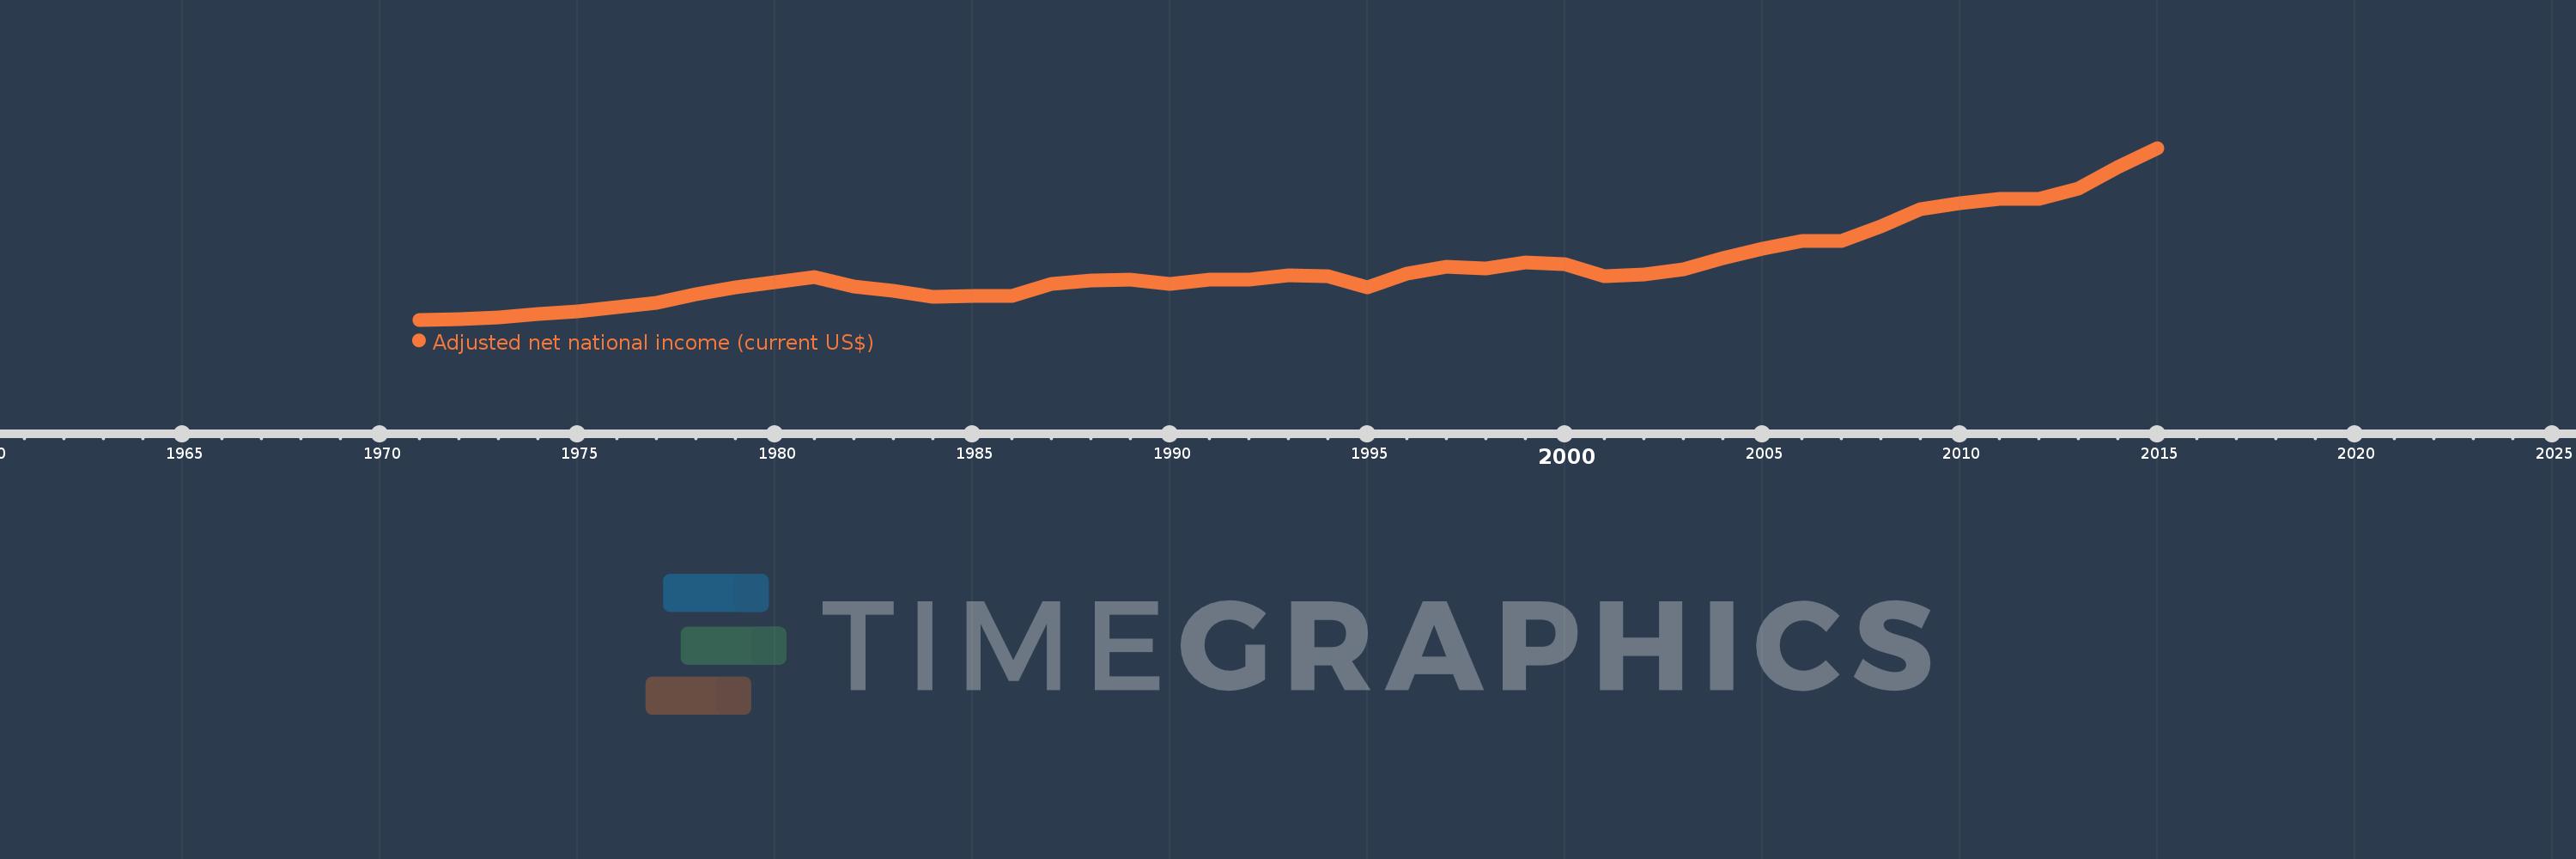
Adjusted net national income (current US$)
2015,2014,2013,2012,2011,2010,2009,2008,2007,2006,2005,2004,2003,2002,2001,2000,1999,1998,1997,1996,1995,1994,1993,1992,1991,1990,1989,1988,1987,1986,1985,1984,1983,1982,1981,1980,1979,1978,1977,1976,1975,1974,1973,1972,1971
This statistics in other country:
AfghanistanAlbaniaAlgeriaAngolaArab WorldArgentinaArmeniaAustraliaAustriaAzerbaijanBahamas, TheBahrainBangladeshBarbadosBelarusBelgiumBelizeBeninBhutanBoliviaBotswanaBrazilBrunei DarussalamBulgariaBurkina FasoBurundiCabo VerdeCambodiaCameroonCanadaCaribbean small statesCentral African RepublicCentral Europe and the BalticsChadChileChinaColombiaComorosCongo, Dem. Rep.Congo, Rep.Costa RicaCote d'IvoireCroatiaCubaCyprusCzech RepublicDenmarkDjiboutiDominicaDominican RepublicEarly-demographic dividendEast Asia & PacificEast Asia & Pacific (excluding high income)East Asia & Pacific (IDA & IBRD countries)EcuadorEgypt, Arab Rep.El SalvadorEquatorial GuineaEritreaEstoniaEthiopiaEuro areaEurope & Central AsiaEurope & Central Asia (excluding high income)Europe & Central Asia (IDA & IBRD countries)European UnionFijiFinlandFragile and conflict affected situationsFranceGabonGambia, TheGeorgiaGermanyGhanaGreeceGuatemalaGuineaGuinea-BissauGuyanaHaitiHeavily indebted poor countries (HIPC)High incomeHondurasHong Kong SAR, ChinaHungaryIBRD onlyIcelandIDA & IBRD totalIDA blendIDA onlyIDA totalIndiaIndonesiaIran, Islamic Rep.IraqIrelandIsraelItalyJamaicaJapanJordanKazakhstanKenyaKiribatiKorea, Rep.KuwaitKyrgyz RepublicLao PDRLate-demographic dividendLatin America & Caribbean Latin America & Caribbean (excluding high income)Latin America & the Caribbean (IDA & IBRD countries)LatviaLeast developed countries: UN classificationLebanonLesothoLiberiaLibyaLithuaniaLow & middle incomeLow incomeLower middle incomeLuxembourgMacedonia, FYRMadagascarMalawiMalaysiaMaldivesMaliMauritaniaMauritiusMexicoMiddle East & North AfricaMiddle East & North Africa (excluding high income)Middle East & North Africa (IDA & IBRD countries)Middle incomeMoldovaMongoliaMoroccoMozambiqueMyanmarNamibiaNepalNetherlandsNew ZealandNicaraguaNigerNigeriaNorth AmericaNorwayOECD membersOmanOther small statesPacific island small statesPakistanPanamaPapua New GuineaParaguayPeruPhilippinesPolandPortugalPost-demographic dividendPre-demographic dividendQatarRomaniaRussian FederationRwandaSamoaSao Tome and PrincipeSaudi ArabiaSenegalSeychellesSierra LeoneSingaporeSlovak RepublicSloveniaSmall statesSolomon IslandsSouth AfricaSouth AsiaSouth Asia (IDA & IBRD)SpainSri LankaSt. LuciaSt. Vincent and the GrenadinesSub-Saharan Africa Sub-Saharan Africa (excluding high income)Sub-Saharan Africa (IDA & IBRD countries)SudanSurinameSwazilandSwedenSwitzerlandSyrian Arab RepublicTajikistanTanzaniaThailandTogoTongaTrinidad and TobagoTunisiaTurkeyTurkmenistanUgandaUkraineUnited Arab EmiratesUnited KingdomUnited StatesUpper middle incomeUruguayUzbekistanVanuatuVenezuela, RBVietnamWorldYemen, Rep.ZambiaZimbabwe Timeline:
This timeline shows a graph from 1971 to 2015 of Cote d'Ivoire. No data until 1970. Number of actual observations by date: 45.
Source name:
World Development Indicators
Source organization:
World Bank staff estimates based on sources and methods in World Bank's "The Changing Wealth of Nations: Measuring Sustainable Development in the New Millennium" (2011).
Categories, topics:
Economy & Growth
Last updated:
apr 23, 2017
Indicators value changes by year
Minimum:
1.367 bln
jan 1, 1971
Maximum:
31.229 bln
jan 1, 2015
At the date of observation
Value
Absolute change
Change from previous value
jan 1, 1971
1.367 bln
+1.367 bln
0.0%
jan 1, 1972
1.449 bln
+81.844 mln
5.99%
jan 1, 1973
1.703 bln
+254.449 mln
17.56%
jan 1, 1974
2.294 bln
+591.026 mln
34.7%
jan 1, 1975
2.849 bln
+554.495 mln
24.17%
jan 1, 1976
3.566 bln
+717.59 mln
25.19%
jan 1, 1977
4.273 bln
+706.441 mln
19.81%
jan 1, 1978
5.737 bln
+1.464 bln
34.27%
jan 1, 1979
7.059 bln
+1.322 bln
23.04%
jan 1, 1980
7.952 bln
+893.045 mln
12.65%
jan 1, 1981
8.804 bln
+851.78 mln
10.71%
jan 1, 1982
7.074 bln
-1.73 bln
-19.66%
jan 1, 1983
6.348 bln
-725.476 mln
-10.26%
jan 1, 1984
5.339 bln
-1.009 bln
-15.9%
jan 1, 1985
5.466 bln
+127.112 mln
2.38%
jan 1, 1986
5.464 bln
-2.51 mln
-0.05%
jan 1, 1987
7.634 bln
+2.171 bln
39.73%
jan 1, 1988
8.261 bln
+626.353 mln
8.2%
jan 1, 1989
8.405 bln
+144.288 mln
1.75%
jan 1, 1990
7.656 bln
-748.962 mln
-8.91%
jan 1, 1991
8.41 bln
+753.905 mln
9.85%
jan 1, 1992
8.38 bln
-29.835 mln
-0.35%
jan 1, 1993
9.045 bln
+664.606 mln
7.93%
jan 1, 1994
8.951 bln
-93.484 mln
-1.03%
jan 1, 1995
7.009 bln
-1.942 bln
-21.7%
jan 1, 1996
9.39 bln
+2.382 bln
33.98%
jan 1, 1997
10.545 bln
+1.154 bln
12.29%
jan 1, 1998
10.35 bln
-194.87 mln
-1.85%
jan 1, 1999
11.387 bln
+1.037 bln
10.02%
jan 1, 2000
11.083 bln
-304.337 mln
-2.67%
jan 1, 2001
8.987 bln
-2.095 bln
-18.91%
jan 1, 2002
9.206 bln
+218.414 mln
2.43%
jan 1, 2003
10.093 bln
+887.234 mln
9.64%
jan 1, 2004
12.093 bln
+2.0 bln
19.82%
jan 1, 2005
13.724 bln
+1.631 bln
13.49%
jan 1, 2006
14.994 bln
+1.269 bln
9.25%
jan 1, 2007
15.094 bln
+100.712 mln
0.67%
jan 1, 2008
17.655 bln
+2.561 bln
16.97%
jan 1, 2009
20.61 bln
+2.955 bln
16.74%
jan 1, 2010
21.658 bln
+1.047 bln
5.08%
jan 1, 2011
22.365 bln
+707.665 mln
3.27%
jan 1, 2012
22.354 bln
-11.086 mln
-0.05%
jan 1, 2013
24.21 bln
+1.856 bln
8.3%
jan 1, 2014
27.936 bln
+3.726 bln
15.39%
jan 1, 2015
31.229 bln
+3.293 bln
11.79%
Ranking of countries by current statistics by years


Comments: