29
/
en
AIzaSyAYiBZKx7MnpbEhh9jyipgxe19OcubqV5w
April 1, 2024
256003
Sweden
SWE
true
2
1
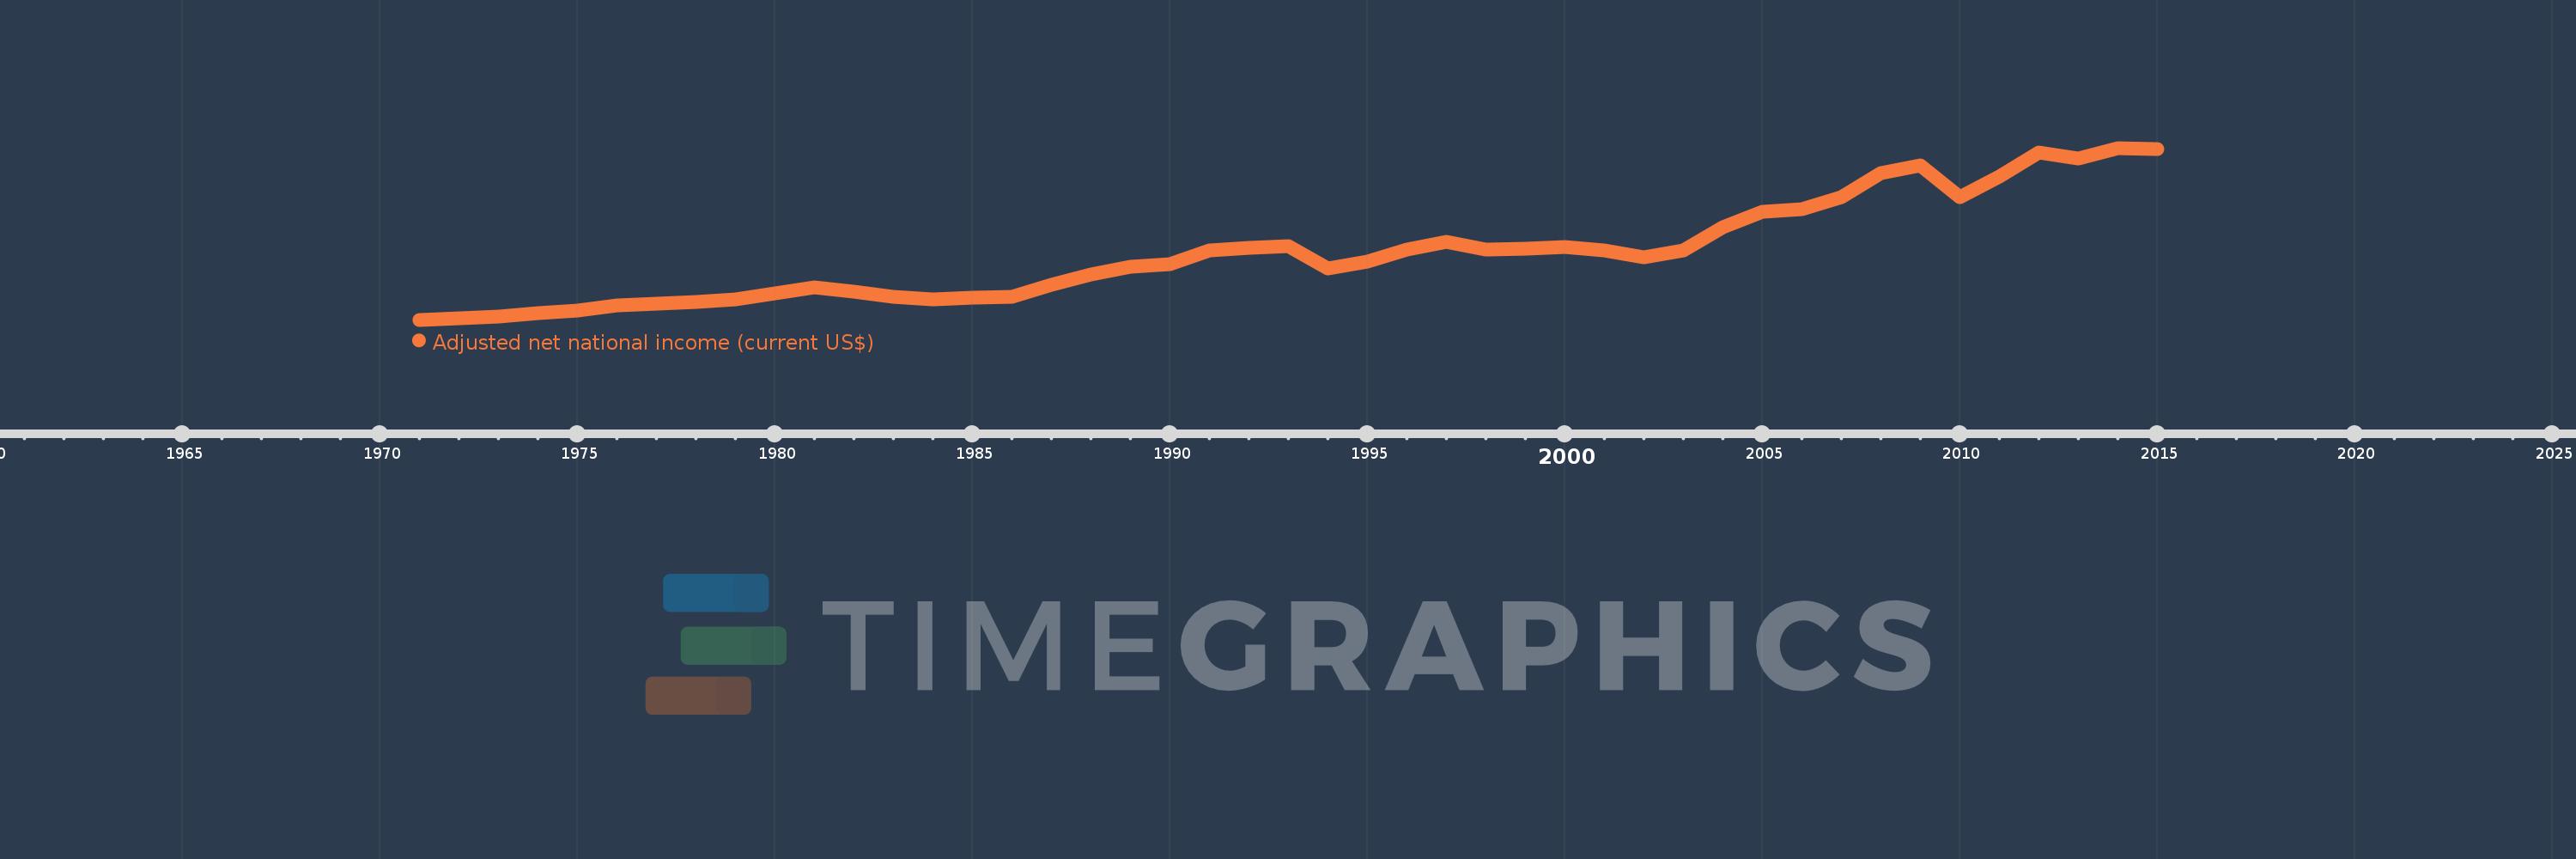
Adjusted net national income (current US$)
2015,2014,2013,2012,2011,2010,2009,2008,2007,2006,2005,2004,2003,2002,2001,2000,1999,1998,1997,1996,1995,1994,1993,1992,1991,1990,1989,1988,1987,1986,1985,1984,1983,1982,1981,1980,1979,1978,1977,1976,1975,1974,1973,1972,1971
This statistics in other country:
AfghanistanAlbaniaAlgeriaAngolaArab WorldArgentinaArmeniaAustraliaAustriaAzerbaijanBahamas, TheBahrainBangladeshBarbadosBelarusBelgiumBelizeBeninBhutanBoliviaBotswanaBrazilBrunei DarussalamBulgariaBurkina FasoBurundiCabo VerdeCambodiaCameroonCanadaCaribbean small statesCentral African RepublicCentral Europe and the BalticsChadChileChinaColombiaComorosCongo, Dem. Rep.Congo, Rep.Costa RicaCote d'IvoireCroatiaCubaCyprusCzech RepublicDenmarkDjiboutiDominicaDominican RepublicEarly-demographic dividendEast Asia & PacificEast Asia & Pacific (excluding high income)East Asia & Pacific (IDA & IBRD countries)EcuadorEgypt, Arab Rep.El SalvadorEquatorial GuineaEritreaEstoniaEthiopiaEuro areaEurope & Central AsiaEurope & Central Asia (excluding high income)Europe & Central Asia (IDA & IBRD countries)European UnionFijiFinlandFragile and conflict affected situationsFranceGabonGambia, TheGeorgiaGermanyGhanaGreeceGuatemalaGuineaGuinea-BissauGuyanaHaitiHeavily indebted poor countries (HIPC)High incomeHondurasHong Kong SAR, ChinaHungaryIBRD onlyIcelandIDA & IBRD totalIDA blendIDA onlyIDA totalIndiaIndonesiaIran, Islamic Rep.IraqIrelandIsraelItalyJamaicaJapanJordanKazakhstanKenyaKiribatiKorea, Rep.KuwaitKyrgyz RepublicLao PDRLate-demographic dividendLatin America & Caribbean Latin America & Caribbean (excluding high income)Latin America & the Caribbean (IDA & IBRD countries)LatviaLeast developed countries: UN classificationLebanonLesothoLiberiaLibyaLithuaniaLow & middle incomeLow incomeLower middle incomeLuxembourgMacedonia, FYRMadagascarMalawiMalaysiaMaldivesMaliMauritaniaMauritiusMexicoMiddle East & North AfricaMiddle East & North Africa (excluding high income)Middle East & North Africa (IDA & IBRD countries)Middle incomeMoldovaMongoliaMoroccoMozambiqueMyanmarNamibiaNepalNetherlandsNew ZealandNicaraguaNigerNigeriaNorth AmericaNorwayOECD membersOmanOther small statesPacific island small statesPakistanPanamaPapua New GuineaParaguayPeruPhilippinesPolandPortugalPost-demographic dividendPre-demographic dividendQatarRomaniaRussian FederationRwandaSamoaSao Tome and PrincipeSaudi ArabiaSenegalSeychellesSierra LeoneSingaporeSlovak RepublicSloveniaSmall statesSolomon IslandsSouth AfricaSouth AsiaSouth Asia (IDA & IBRD)SpainSri LankaSt. LuciaSt. Vincent and the GrenadinesSub-Saharan Africa Sub-Saharan Africa (excluding high income)Sub-Saharan Africa (IDA & IBRD countries)SudanSurinameSwazilandSwedenSwitzerlandSyrian Arab RepublicTajikistanTanzaniaThailandTogoTongaTrinidad and TobagoTunisiaTurkeyTurkmenistanUgandaUkraineUnited Arab EmiratesUnited KingdomUnited StatesUpper middle incomeUruguayUzbekistanVanuatuVenezuela, RBVietnamWorldYemen, Rep.ZambiaZimbabwe Timeline:
This timeline shows a graph from 1971 to 2015 of Sweden. No data until 1970. Number of actual observations by date: 45.
Source name:
World Development Indicators
Source organization:
World Bank staff estimates based on sources and methods in World Bank's "The Changing Wealth of Nations: Measuring Sustainable Development in the New Millennium" (2011).
Categories, topics:
Economy & Growth
Last updated:
apr 23, 2017
Indicators value changes by year
Minimum:
33.475 bln
jan 1, 1971
Maximum:
497.718 bln
jan 1, 2014
At the date of observation
Value
Absolute change
Change from previous value
jan 1, 1971
33.475 bln
+33.475 bln
0.0%
jan 1, 1972
36.515 bln
+3.04 bln
9.08%
jan 1, 1973
43.016 bln
+6.501 bln
17.8%
jan 1, 1974
52.188 bln
+9.172 bln
21.32%
jan 1, 1975
57.549 bln
+5.361 bln
10.27%
jan 1, 1976
72.502 bln
+14.953 bln
25.98%
jan 1, 1977
77.829 bln
+5.328 bln
7.35%
jan 1, 1978
81.343 bln
+3.514 bln
4.52%
jan 1, 1979
89.586 bln
+8.242 bln
10.13%
jan 1, 1980
105.801 bln
+16.215 bln
18.1%
jan 1, 1981
121.996 bln
+16.195 bln
15.31%
jan 1, 1982
110.454 bln
-11.542 bln
-9.46%
jan 1, 1983
96.502 bln
-13.952 bln
-12.63%
jan 1, 1984
88.143 bln
-8.358 bln
-8.66%
jan 1, 1985
92.119 bln
+3.976 bln
4.51%
jan 1, 1986
96.105 bln
+3.986 bln
4.33%
jan 1, 1987
127.837 bln
+31.731 bln
33.02%
jan 1, 1988
156.157 bln
+28.32 bln
22.15%
jan 1, 1989
175.905 bln
+19.749 bln
12.65%
jan 1, 1990
184.259 bln
+8.354 bln
4.75%
jan 1, 1991
219.79 bln
+35.531 bln
19.28%
jan 1, 1992
228.793 bln
+9.004 bln
4.1%
jan 1, 1993
233.147 bln
+4.354 bln
1.9%
jan 1, 1994
171.88 bln
-61.267 bln
-26.28%
jan 1, 1995
189.908 bln
+18.028 bln
10.49%
jan 1, 1996
223.867 bln
+33.959 bln
17.88%
jan 1, 1997
243.598 bln
+19.731 bln
8.81%
jan 1, 1998
223.398 bln
-20.2 bln
-8.29%
jan 1, 1999
226.205 bln
+2.807 bln
1.26%
jan 1, 2000
229.664 bln
+3.459 bln
1.53%
jan 1, 2001
219.745 bln
-9.92 bln
-4.32%
jan 1, 2002
201.633 bln
-18.112 bln
-8.24%
jan 1, 2003
221.763 bln
+20.13 bln
9.98%
jan 1, 2004
284.423 bln
+62.66 bln
28.26%
jan 1, 2005
324.582 bln
+40.159 bln
14.12%
jan 1, 2006
333.121 bln
+8.539 bln
2.63%
jan 1, 2007
364.337 bln
+31.217 bln
9.37%
jan 1, 2008
428.71 bln
+64.373 bln
17.67%
jan 1, 2009
450.329 bln
+21.619 bln
5.04%
jan 1, 2010
364.66 bln
-85.669 bln
-19.02%
jan 1, 2011
419.368 bln
+54.708 bln
15.0%
jan 1, 2012
485.436 bln
+66.068 bln
15.75%
jan 1, 2013
468.704 bln
-16.732 bln
-3.45%
jan 1, 2014
497.718 bln
+29.014 bln
6.19%
jan 1, 2015
494.459 bln
-3.259 bln
-0.65%
Ranking of countries by current statistics by years


Comments: