29
/
en
AIzaSyAYiBZKx7MnpbEhh9jyipgxe19OcubqV5w
April 1, 2024
115534
Cuba
CUB
true
2
1
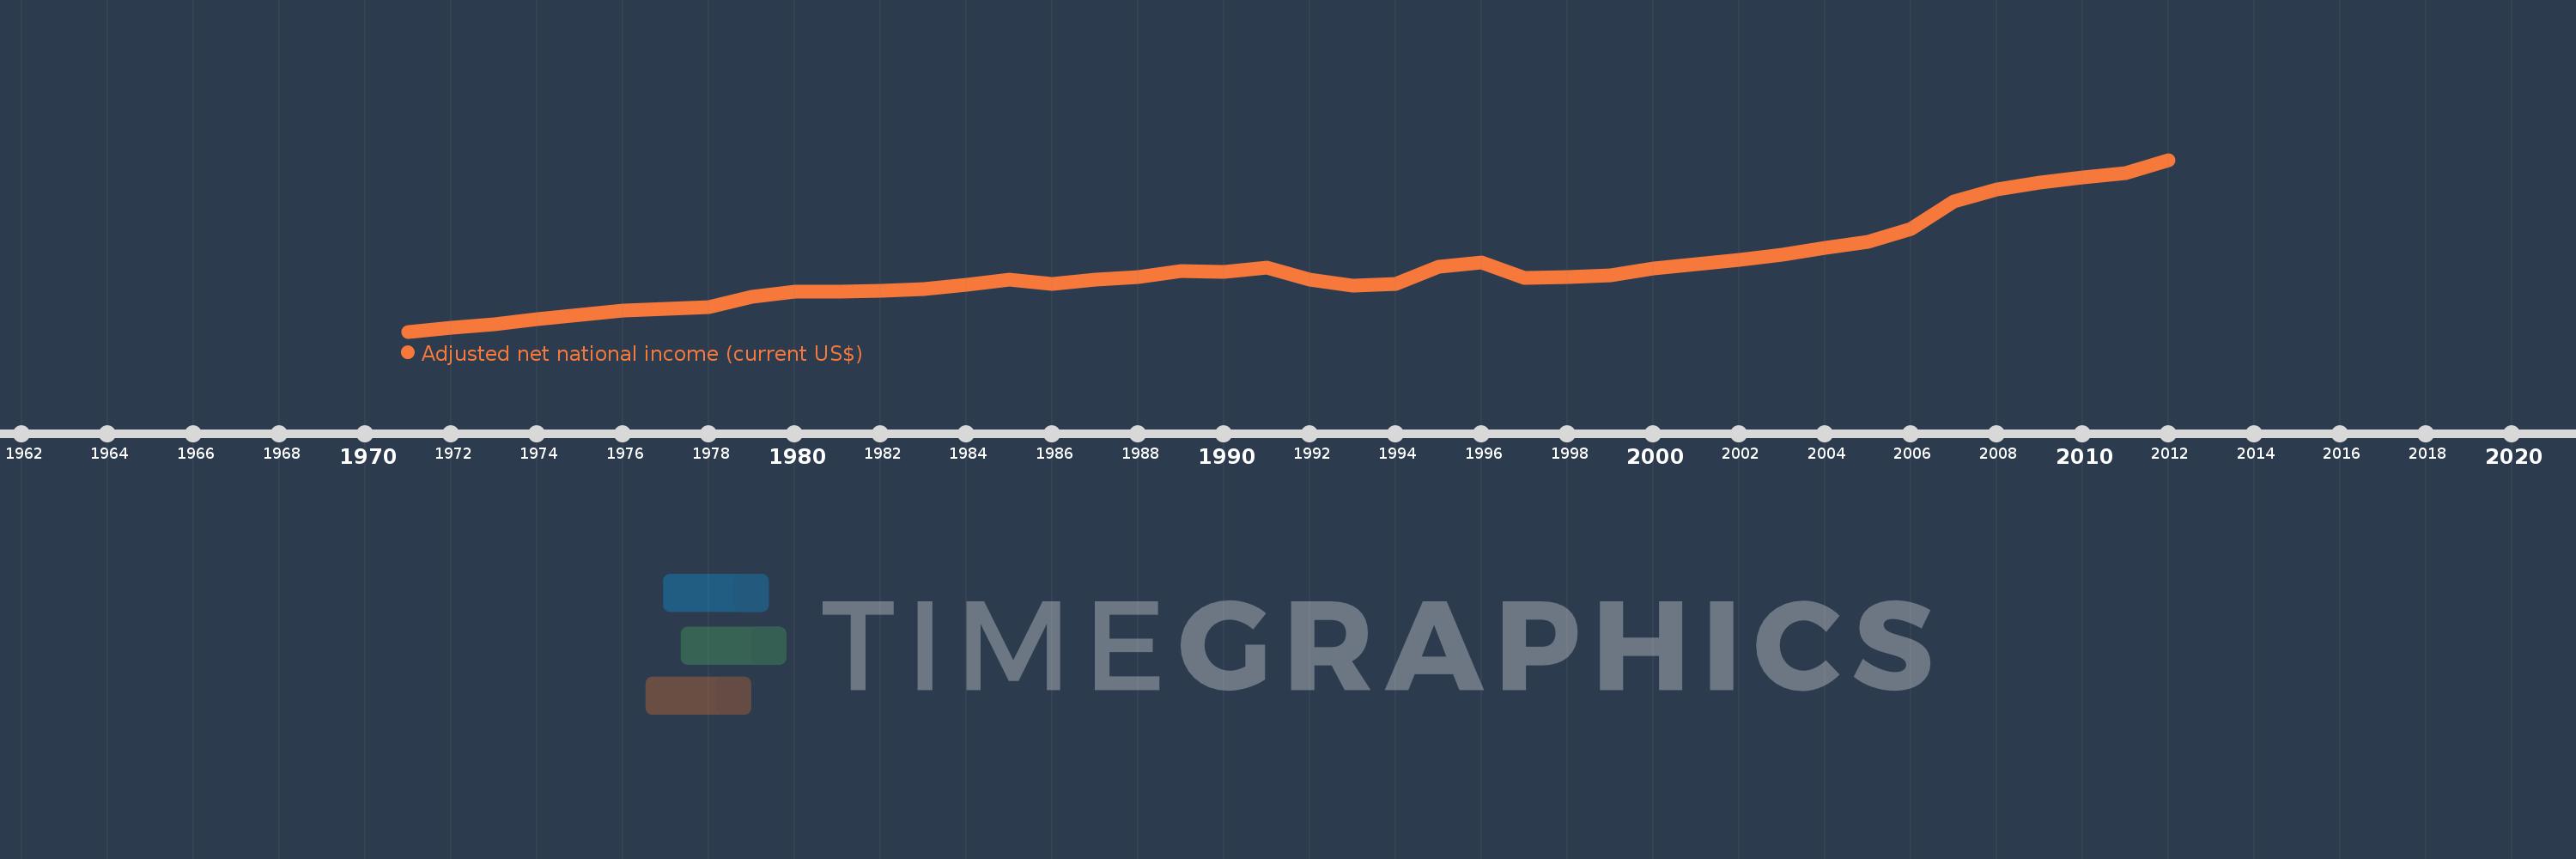
Adjusted net national income (current US$)
2012,2011,2010,2009,2008,2007,2006,2005,2004,2003,2002,2001,2000,1999,1998,1997,1996,1995,1994,1993,1992,1991,1990,1989,1988,1987,1986,1985,1984,1983,1982,1981,1980,1979,1978,1977,1976,1975,1974,1973,1972,1971
This statistics in other country:
AfghanistanAlbaniaAlgeriaAngolaArab WorldArgentinaArmeniaAustraliaAustriaAzerbaijanBahamas, TheBahrainBangladeshBarbadosBelarusBelgiumBelizeBeninBhutanBoliviaBotswanaBrazilBrunei DarussalamBulgariaBurkina FasoBurundiCabo VerdeCambodiaCameroonCanadaCaribbean small statesCentral African RepublicCentral Europe and the BalticsChadChileChinaColombiaComorosCongo, Dem. Rep.Congo, Rep.Costa RicaCote d'IvoireCroatiaCubaCyprusCzech RepublicDenmarkDjiboutiDominicaDominican RepublicEarly-demographic dividendEast Asia & PacificEast Asia & Pacific (excluding high income)East Asia & Pacific (IDA & IBRD countries)EcuadorEgypt, Arab Rep.El SalvadorEquatorial GuineaEritreaEstoniaEthiopiaEuro areaEurope & Central AsiaEurope & Central Asia (excluding high income)Europe & Central Asia (IDA & IBRD countries)European UnionFijiFinlandFragile and conflict affected situationsFranceGabonGambia, TheGeorgiaGermanyGhanaGreeceGuatemalaGuineaGuinea-BissauGuyanaHaitiHeavily indebted poor countries (HIPC)High incomeHondurasHong Kong SAR, ChinaHungaryIBRD onlyIcelandIDA & IBRD totalIDA blendIDA onlyIDA totalIndiaIndonesiaIran, Islamic Rep.IraqIrelandIsraelItalyJamaicaJapanJordanKazakhstanKenyaKiribatiKorea, Rep.KuwaitKyrgyz RepublicLao PDRLate-demographic dividendLatin America & Caribbean Latin America & Caribbean (excluding high income)Latin America & the Caribbean (IDA & IBRD countries)LatviaLeast developed countries: UN classificationLebanonLesothoLiberiaLibyaLithuaniaLow & middle incomeLow incomeLower middle incomeLuxembourgMacedonia, FYRMadagascarMalawiMalaysiaMaldivesMaliMauritaniaMauritiusMexicoMiddle East & North AfricaMiddle East & North Africa (excluding high income)Middle East & North Africa (IDA & IBRD countries)Middle incomeMoldovaMongoliaMoroccoMozambiqueMyanmarNamibiaNepalNetherlandsNew ZealandNicaraguaNigerNigeriaNorth AmericaNorwayOECD membersOmanOther small statesPacific island small statesPakistanPanamaPapua New GuineaParaguayPeruPhilippinesPolandPortugalPost-demographic dividendPre-demographic dividendQatarRomaniaRussian FederationRwandaSamoaSao Tome and PrincipeSaudi ArabiaSenegalSeychellesSierra LeoneSingaporeSlovak RepublicSloveniaSmall statesSolomon IslandsSouth AfricaSouth AsiaSouth Asia (IDA & IBRD)SpainSri LankaSt. LuciaSt. Vincent and the GrenadinesSub-Saharan Africa Sub-Saharan Africa (excluding high income)Sub-Saharan Africa (IDA & IBRD countries)SudanSurinameSwazilandSwedenSwitzerlandSyrian Arab RepublicTajikistanTanzaniaThailandTogoTongaTrinidad and TobagoTunisiaTurkeyTurkmenistanUgandaUkraineUnited Arab EmiratesUnited KingdomUnited StatesUpper middle incomeUruguayUzbekistanVanuatuVenezuela, RBVietnamWorldYemen, Rep.ZambiaZimbabwe Timeline:
This timeline shows a graph from 1971 to 2012 of Cuba. No data until 1970. Number of actual observations by date: 42.
Source name:
World Development Indicators
Source organization:
World Bank staff estimates based on sources and methods in World Bank's "The Changing Wealth of Nations: Measuring Sustainable Development in the New Millennium" (2011).
Categories, topics:
Economy & Growth
Last updated:
apr 23, 2017
Indicators value changes by year
Minimum:
5.243 bln
jan 1, 1971
Maximum:
59.983 bln
jan 1, 2012
At the date of observation
Value
Absolute change
Change from previous value
jan 1, 1971
5.243 bln
+5.243 bln
0.0%
jan 1, 1972
6.367 bln
+1.124 bln
21.44%
jan 1, 1973
7.491 bln
+1.125 bln
17.66%
jan 1, 1974
9.197 bln
+1.706 bln
22.77%
jan 1, 1975
10.505 bln
+1.308 bln
14.22%
jan 1, 1976
11.932 bln
+1.427 bln
13.58%
jan 1, 1977
12.62 bln
+688.569 mln
5.77%
jan 1, 1978
12.993 bln
+372.896 mln
2.95%
jan 1, 1979
16.335 bln
+3.342 bln
25.72%
jan 1, 1980
17.886 bln
+1.551 bln
9.49%
jan 1, 1981
18.025 bln
+138.798 mln
0.78%
jan 1, 1982
18.215 bln
+190.311 mln
1.06%
jan 1, 1983
18.866 bln
+650.985 mln
3.57%
jan 1, 1984
20.023 bln
+1.157 bln
6.13%
jan 1, 1985
21.689 bln
+1.666 bln
8.32%
jan 1, 1986
20.477 bln
-1.212 bln
-5.59%
jan 1, 1987
21.716 bln
+1.239 bln
6.05%
jan 1, 1988
22.604 bln
+887.634 mln
4.09%
jan 1, 1989
24.561 bln
+1.957 bln
8.66%
jan 1, 1990
24.215 bln
-346.671 mln
-1.41%
jan 1, 1991
25.612 bln
+1.397 bln
5.77%
jan 1, 1992
21.891 bln
-3.72 bln
-14.53%
jan 1, 1993
20.021 bln
-1.871 bln
-8.54%
jan 1, 1994
20.355 bln
+334.564 mln
1.67%
jan 1, 1995
25.813 bln
+5.458 bln
26.81%
jan 1, 1996
27.225 bln
+1.412 bln
5.47%
jan 1, 1997
22.336 bln
-4.888 bln
-17.96%
jan 1, 1998
22.655 bln
+318.7 mln
1.43%
jan 1, 1999
23.048 bln
+392.666 mln
1.73%
jan 1, 2000
25.326 bln
+2.278 bln
9.88%
jan 1, 2001
26.842 bln
+1.516 bln
5.99%
jan 1, 2002
28.134 bln
+1.292 bln
4.81%
jan 1, 2003
29.803 bln
+1.668 bln
5.93%
jan 1, 2004
31.908 bln
+2.105 bln
7.06%
jan 1, 2005
33.796 bln
+1.888 bln
5.92%
jan 1, 2006
37.822 bln
+4.026 bln
11.91%
jan 1, 2007
46.703 bln
+8.882 bln
23.48%
jan 1, 2008
50.421 bln
+3.717 bln
7.96%
jan 1, 2009
52.777 bln
+2.357 bln
4.67%
jan 1, 2010
54.338 bln
+1.56 bln
2.96%
jan 1, 2011
55.793 bln
+1.455 bln
2.68%
jan 1, 2012
59.983 bln
+4.19 bln
7.51%
Ranking of countries by current statistics by years


Comments: