29
/
en
AIzaSyAYiBZKx7MnpbEhh9jyipgxe19OcubqV5w
April 1, 2024
195115
Mexico
MEX
true
2
1
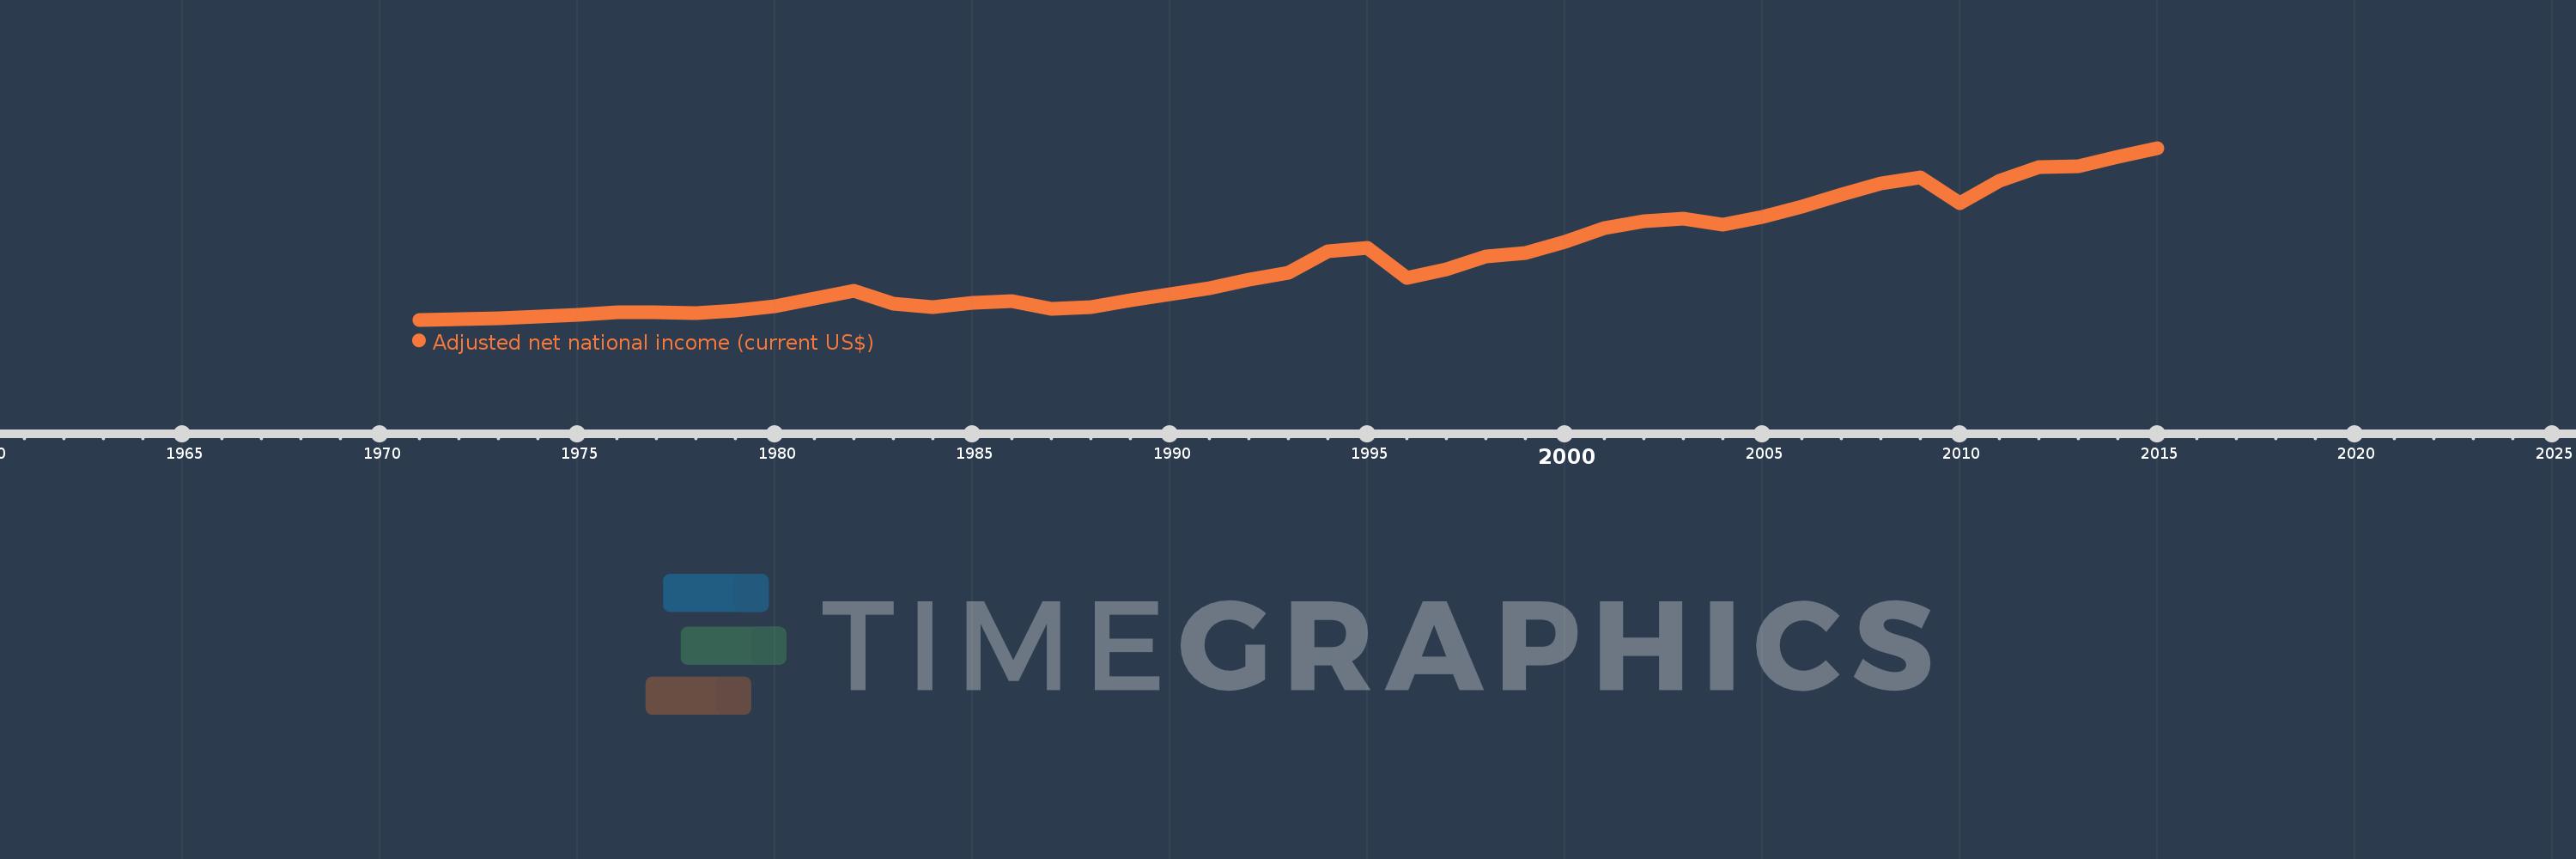
Adjusted net national income (current US$)
2015,2014,2013,2012,2011,2010,2009,2008,2007,2006,2005,2004,2003,2002,2001,2000,1999,1998,1997,1996,1995,1994,1993,1992,1991,1990,1989,1988,1987,1986,1985,1984,1983,1982,1981,1980,1979,1978,1977,1976,1975,1974,1973,1972,1971
This statistics in other country:
AfghanistanAlbaniaAlgeriaAngolaArab WorldArgentinaArmeniaAustraliaAustriaAzerbaijanBahamas, TheBahrainBangladeshBarbadosBelarusBelgiumBelizeBeninBhutanBoliviaBotswanaBrazilBrunei DarussalamBulgariaBurkina FasoBurundiCabo VerdeCambodiaCameroonCanadaCaribbean small statesCentral African RepublicCentral Europe and the BalticsChadChileChinaColombiaComorosCongo, Dem. Rep.Congo, Rep.Costa RicaCote d'IvoireCroatiaCubaCyprusCzech RepublicDenmarkDjiboutiDominicaDominican RepublicEarly-demographic dividendEast Asia & PacificEast Asia & Pacific (excluding high income)East Asia & Pacific (IDA & IBRD countries)EcuadorEgypt, Arab Rep.El SalvadorEquatorial GuineaEritreaEstoniaEthiopiaEuro areaEurope & Central AsiaEurope & Central Asia (excluding high income)Europe & Central Asia (IDA & IBRD countries)European UnionFijiFinlandFragile and conflict affected situationsFranceGabonGambia, TheGeorgiaGermanyGhanaGreeceGuatemalaGuineaGuinea-BissauGuyanaHaitiHeavily indebted poor countries (HIPC)High incomeHondurasHong Kong SAR, ChinaHungaryIBRD onlyIcelandIDA & IBRD totalIDA blendIDA onlyIDA totalIndiaIndonesiaIran, Islamic Rep.IraqIrelandIsraelItalyJamaicaJapanJordanKazakhstanKenyaKiribatiKorea, Rep.KuwaitKyrgyz RepublicLao PDRLate-demographic dividendLatin America & Caribbean Latin America & Caribbean (excluding high income)Latin America & the Caribbean (IDA & IBRD countries)LatviaLeast developed countries: UN classificationLebanonLesothoLiberiaLibyaLithuaniaLow & middle incomeLow incomeLower middle incomeLuxembourgMacedonia, FYRMadagascarMalawiMalaysiaMaldivesMaliMauritaniaMauritiusMexicoMiddle East & North AfricaMiddle East & North Africa (excluding high income)Middle East & North Africa (IDA & IBRD countries)Middle incomeMoldovaMongoliaMoroccoMozambiqueMyanmarNamibiaNepalNetherlandsNew ZealandNicaraguaNigerNigeriaNorth AmericaNorwayOECD membersOmanOther small statesPacific island small statesPakistanPanamaPapua New GuineaParaguayPeruPhilippinesPolandPortugalPost-demographic dividendPre-demographic dividendQatarRomaniaRussian FederationRwandaSamoaSao Tome and PrincipeSaudi ArabiaSenegalSeychellesSierra LeoneSingaporeSlovak RepublicSloveniaSmall statesSolomon IslandsSouth AfricaSouth AsiaSouth Asia (IDA & IBRD)SpainSri LankaSt. LuciaSt. Vincent and the GrenadinesSub-Saharan Africa Sub-Saharan Africa (excluding high income)Sub-Saharan Africa (IDA & IBRD countries)SudanSurinameSwazilandSwedenSwitzerlandSyrian Arab RepublicTajikistanTanzaniaThailandTogoTongaTrinidad and TobagoTunisiaTurkeyTurkmenistanUgandaUkraineUnited Arab EmiratesUnited KingdomUnited StatesUpper middle incomeUruguayUzbekistanVanuatuVenezuela, RBVietnamWorldYemen, Rep.ZambiaZimbabwe Timeline:
This timeline shows a graph from 1971 to 2015 of Mexico. No data until 1970. Number of actual observations by date: 45.
Source name:
World Development Indicators
Source organization:
World Bank staff estimates based on sources and methods in World Bank's "The Changing Wealth of Nations: Measuring Sustainable Development in the New Millennium" (2011).
Categories, topics:
Economy & Growth
Last updated:
apr 23, 2017
Indicators value changes by year
Minimum:
31.703 bln
jan 1, 1971
Maximum:
1.048 trl
jan 1, 2015
At the date of observation
Value
Absolute change
Change from previous value
jan 1, 1971
31.703 bln
+31.703 bln
0.0%
jan 1, 1972
35.04 bln
+3.336 bln
10.52%
jan 1, 1973
40.327 bln
+5.288 bln
15.09%
jan 1, 1974
49.462 bln
+9.134 bln
22.65%
jan 1, 1975
63.196 bln
+13.734 bln
27.77%
jan 1, 1976
76.922 bln
+13.726 bln
21.72%
jan 1, 1977
76.998 bln
+75.861 mln
0.1%
jan 1, 1978
69.633 bln
-7.365 bln
-9.57%
jan 1, 1979
86.965 bln
+17.332 bln
24.89%
jan 1, 1980
109.112 bln
+22.147 bln
25.47%
jan 1, 1981
156.801 bln
+47.689 bln
43.71%
jan 1, 1982
202.664 bln
+45.863 bln
29.25%
jan 1, 1983
128.091 bln
-74.573 bln
-36.8%
jan 1, 1984
107.14 bln
-20.952 bln
-16.36%
jan 1, 1985
131.589 bln
+24.449 bln
22.82%
jan 1, 1986
142.225 bln
+10.636 bln
8.08%
jan 1, 1987
98.424 bln
-43.802 bln
-30.8%
jan 1, 1988
107.347 bln
+8.924 bln
9.07%
jan 1, 1989
146.973 bln
+39.626 bln
36.91%
jan 1, 1990
182.9 bln
+35.927 bln
24.44%
jan 1, 1991
218.13 bln
+35.23 bln
19.26%
jan 1, 1992
267.308 bln
+49.179 bln
22.55%
jan 1, 1993
311.331 bln
+44.023 bln
16.47%
jan 1, 1994
436.727 bln
+125.396 bln
40.28%
jan 1, 1995
456.001 bln
+19.274 bln
4.41%
jan 1, 1996
280.879 bln
-175.122 bln
-38.4%
jan 1, 1997
327.629 bln
+46.749 bln
16.64%
jan 1, 1998
405.197 bln
+77.569 bln
23.68%
jan 1, 1999
424.54 bln
+19.343 bln
4.77%
jan 1, 2000
492.716 bln
+68.176 bln
16.06%
jan 1, 2001
576.026 bln
+83.31 bln
16.91%
jan 1, 2002
614.964 bln
+38.938 bln
6.76%
jan 1, 2003
630.398 bln
+15.434 bln
2.51%
jan 1, 2004
595.775 bln
-34.622 bln
-5.49%
jan 1, 2005
639.242 bln
+43.467 bln
7.3%
jan 1, 2006
700.372 bln
+61.13 bln
9.56%
jan 1, 2007
774.772 bln
+74.4 bln
10.62%
jan 1, 2008
839.428 bln
+64.655 bln
8.35%
jan 1, 2009
872.2 bln
+32.773 bln
3.9%
jan 1, 2010
720.902 bln
-151.298 bln
-17.35%
jan 1, 2011
854.933 bln
+134.031 bln
18.59%
jan 1, 2012
933.434 bln
+78.5 bln
9.18%
jan 1, 2013
941.586 bln
+8.153 bln
0.87%
jan 1, 2014
996.845 bln
+55.259 bln
5.87%
jan 1, 2015
1.048 trl
+51.471 bln
5.16%
Ranking of countries by current statistics by years


Comments: