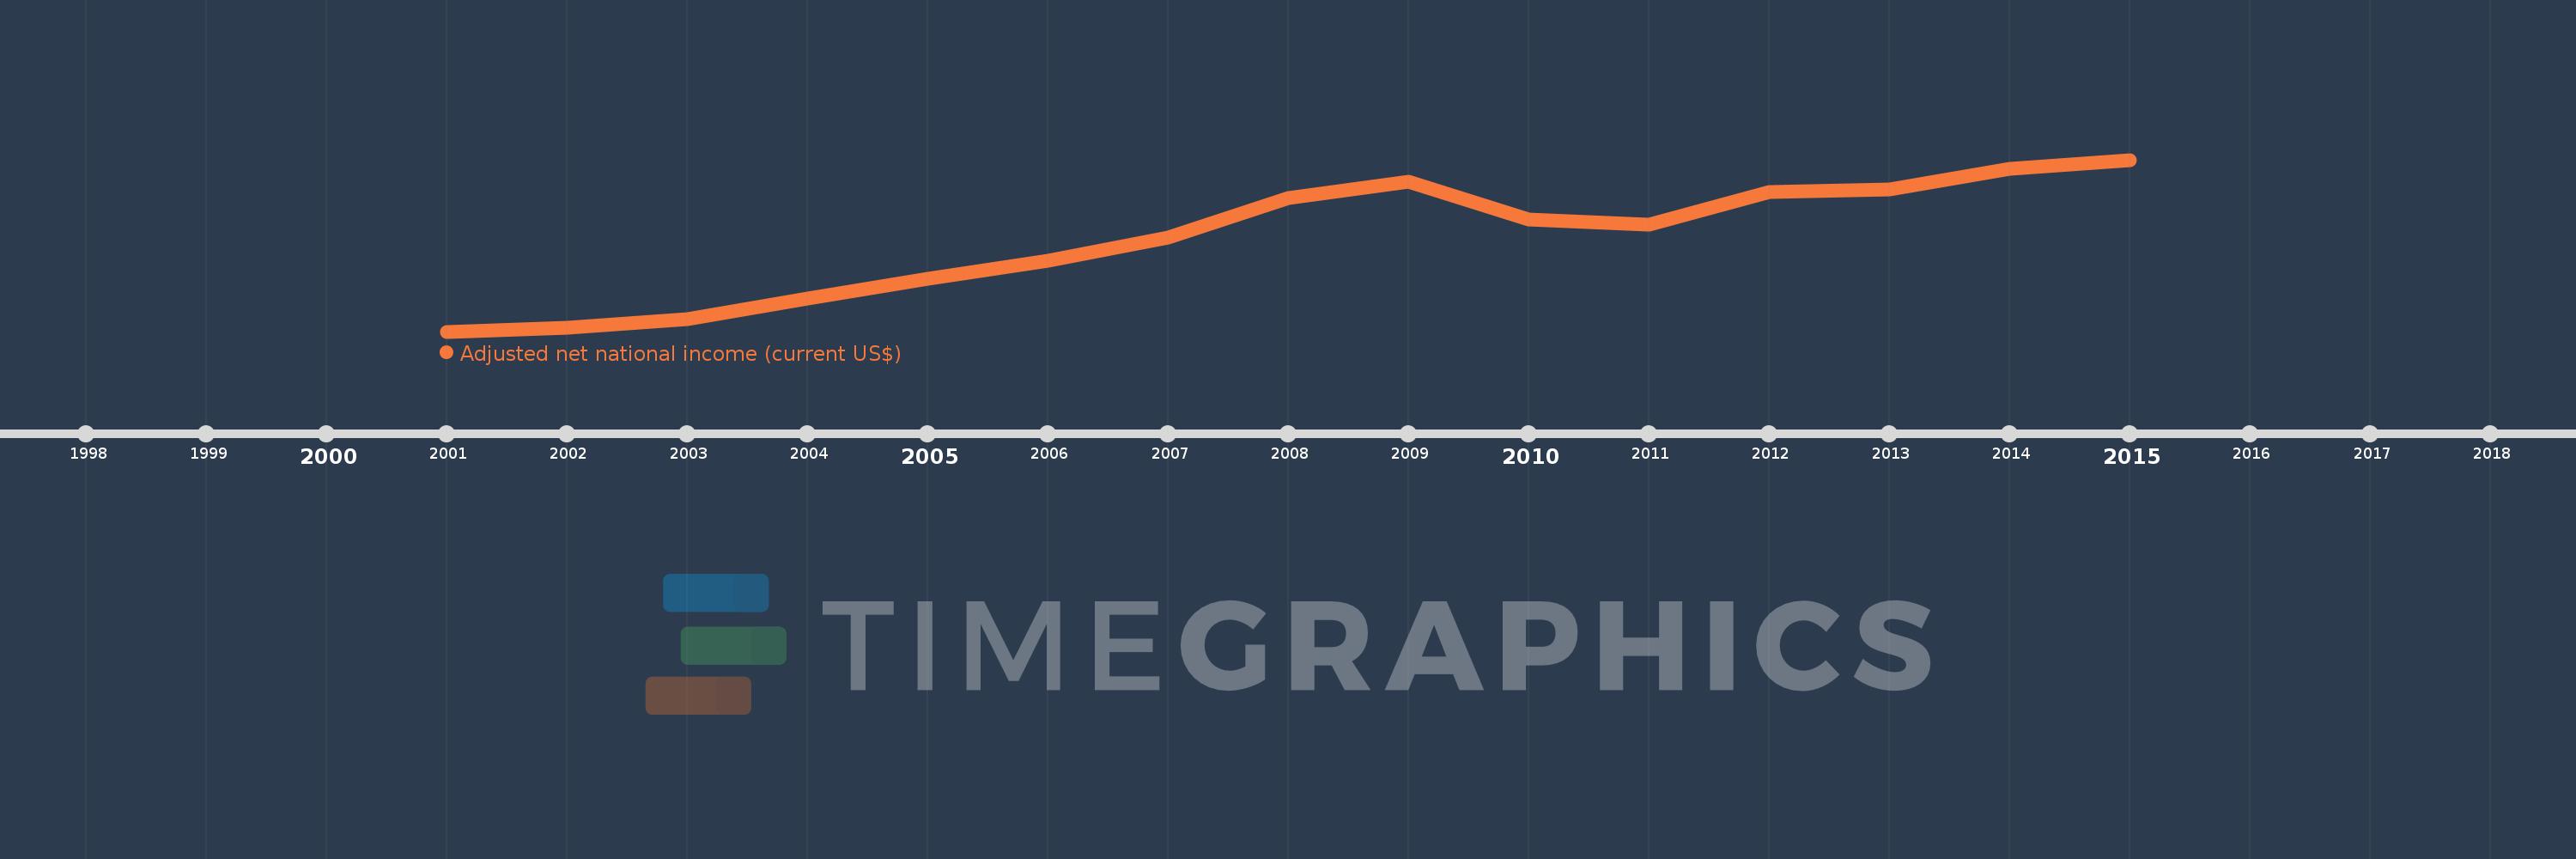
This timeline shows a graph from 2001 to 2015 of Estonia. No data until 2000. Number of actual observations by date: 15.
Source name:
World Development Indicators
Source organization:
World Bank staff estimates based on sources and methods in World Bank's "The Changing Wealth of Nations: Measuring Sustainable Development in the New Millennium" (2011).
Categories, topics:
Economy & Growth
Last updated:
apr 23, 2017
Indicators value changes by year
Meaning:
13.753 bln
Minimum:
4.674 bln
jan 1, 2001
Maximum:
21.557 bln
jan 1, 2015
At the date of observation
Value
Absolute change
Change from the previous value
jan 1, 2001
4.674 bln
+4.674 bln
0.0%
jan 1, 2002
5.081 bln
+407.471 mln
8.72%
jan 1, 2003
5.933 bln
+852.203 mln
16.77%
jan 1, 2004
7.899 bln
+1.965 bln
33.12%
jan 1, 2005
9.826 bln
+1.927 bln
24.4%
jan 1, 2006
11.656 bln
+1.83 bln
18.63%
jan 1, 2007
13.911 bln
+2.255 bln
19.35%
jan 1, 2008
17.836 bln
+3.925 bln
28.21%
jan 1, 2009
19.377 bln
+1.541 bln
8.64%
jan 1, 2010
15.7 bln
-3.676 bln
-18.97%
jan 1, 2011
15.158 bln
-542.487 mln
-3.46%
jan 1, 2012
18.36 bln
+3.202 bln
21.12%
jan 1, 2013
18.66 bln
+300.764 mln
1.64%
jan 1, 2014
20.675 bln
+2.015 bln
10.8%
jan 1, 2015
21.557 bln
+882.018 mln
4.27%
Ranking of countries by current statistics by years
