29
/
en
AIzaSyAYiBZKx7MnpbEhh9jyipgxe19OcubqV5w
April 1, 2024
62796
World
WLD
false
2
1
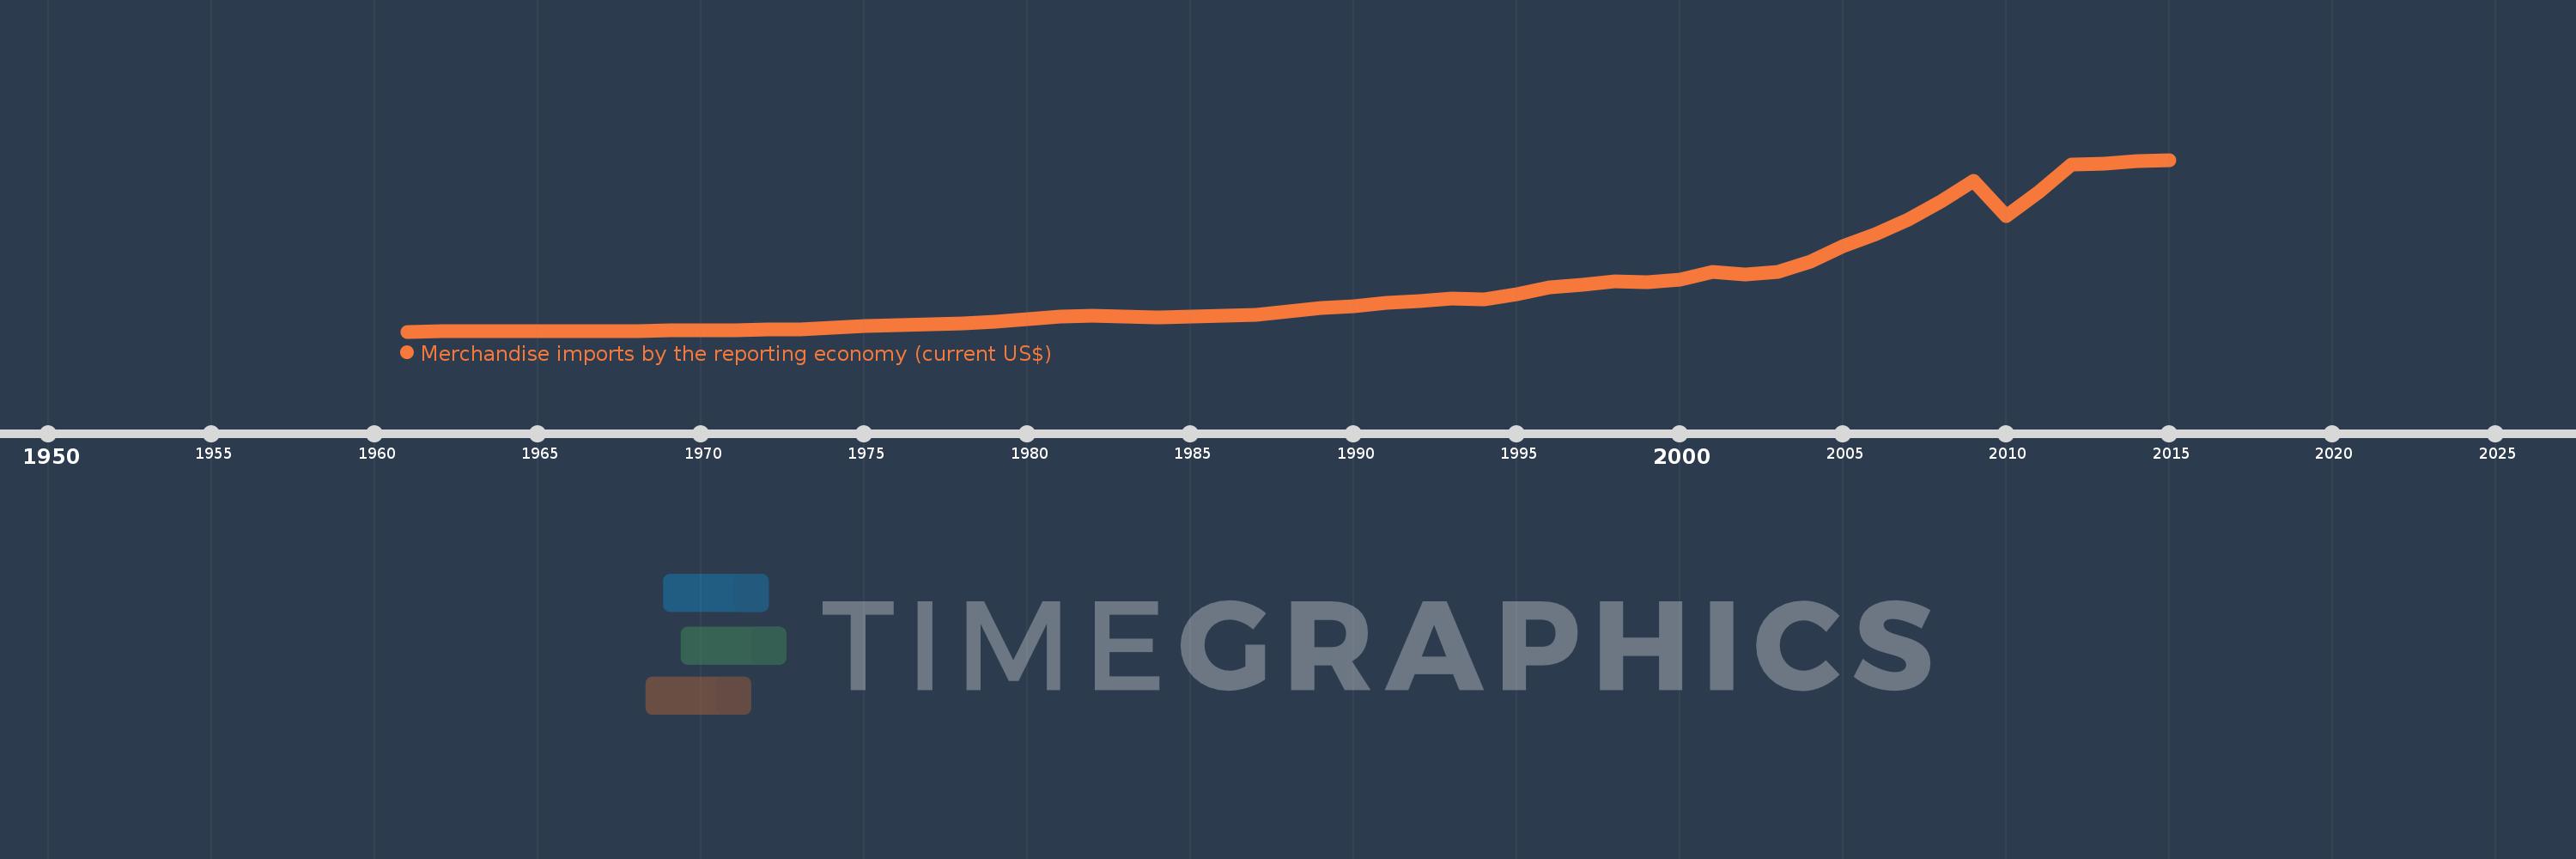
Merchandise imports by the reporting economy (current US$)
2015,2014,2013,2012,2011,2010,2009,2008,2007,2006,2005,2004,2003,2002,2001,2000,1999,1998,1997,1996,1995,1994,1993,1992,1991,1990,1989,1988,1987,1986,1985,1984,1983,1982,1981,1980,1979,1978,1977,1976,1975,1974,1973,1972,1971,1970,1969,1968,1967,1966,1965,1964,1963,1962,1961
This statistics in other country:
AfghanistanAlbaniaAlgeriaAmerican SamoaAngolaAntigua and BarbudaArab WorldArgentinaArmeniaArubaAustraliaAustriaAzerbaijanBahamas, TheBahrainBangladeshBarbadosBelarusBelgiumBelizeBeninBermudaBoliviaBosnia and HerzegovinaBrazilBrunei DarussalamBulgariaBurkina FasoBurundiCabo VerdeCambodiaCameroonCanadaCaribbean small statesCentral African RepublicCentral Europe and the BalticsChadChileChinaColombiaComorosCongo, Dem. Rep.Congo, Rep.Costa RicaCote d'IvoireCroatiaCubaCyprusCzech RepublicDenmarkDjiboutiDominicaDominican RepublicEarly-demographic dividendEast Asia & PacificEast Asia & Pacific (excluding high income)East Asia & Pacific (IDA & IBRD countries)EcuadorEgypt, Arab Rep.El SalvadorEquatorial GuineaEstoniaEthiopiaEuro areaEurope & Central AsiaEurope & Central Asia (excluding high income)Europe & Central Asia (IDA & IBRD countries)European UnionFaroe IslandsFijiFinlandFragile and conflict affected situationsFranceFrench PolynesiaGabonGambia, TheGeorgiaGermanyGhanaGibraltarGreeceGreenlandGrenadaGuamGuatemalaGuineaGuinea-BissauGuyanaHaitiHeavily indebted poor countries (HIPC)High incomeHondurasHong Kong SAR, ChinaHungaryIBRD onlyIcelandIDA & IBRD totalIDA blendIDA onlyIDA totalIndiaIndonesiaIran, Islamic Rep.IraqIrelandIsraelItalyJamaicaJapanJordanKazakhstanKenyaKiribatiKorea, Dem. People’s Rep.Korea, Rep.KosovoKuwaitKyrgyz RepublicLao PDRLate-demographic dividendLatin America & Caribbean Latin America & Caribbean (excluding high income)Latin America & the Caribbean (IDA & IBRD countries)LatviaLeast developed countries: UN classificationLebanonLiberiaLibyaLithuaniaLow & middle incomeLow incomeLower middle incomeLuxembourgMacao SAR, ChinaMacedonia, FYRMadagascarMalawiMalaysiaMaldivesMaliMaltaMauritaniaMauritiusMexicoMiddle East & North AfricaMiddle East & North Africa (excluding high income)Middle East & North Africa (IDA & IBRD countries)Middle incomeMoldovaMongoliaMontenegroMoroccoMozambiqueMyanmarNauruNepalNetherlandsNew CaledoniaNew ZealandNicaraguaNigerNigeriaNorth AmericaNorwayOECD membersOmanOther small statesPacific island small statesPakistanPanamaPapua New GuineaParaguayPeruPhilippinesPolandPortugalPost-demographic dividendPre-demographic dividendQatarRomaniaRussian FederationRwandaSamoaSao Tome and PrincipeSaudi ArabiaSenegalSerbiaSeychellesSierra LeoneSingaporeSlovak RepublicSloveniaSmall statesSolomon IslandsSomaliaSouth AfricaSouth AsiaSouth Asia (IDA & IBRD)SpainSri LankaSt. Kitts and NevisSt. LuciaSt. Vincent and the GrenadinesSub-Saharan Africa Sub-Saharan Africa (excluding high income)Sub-Saharan Africa (IDA & IBRD countries)SudanSurinameSwedenSwitzerlandSyrian Arab RepublicTajikistanTanzaniaThailandTogoTongaTrinidad and TobagoTunisiaTurkeyTurkmenistanTuvaluUgandaUkraineUnited Arab EmiratesUnited KingdomUnited StatesUpper middle incomeUruguayUzbekistanVanuatuVenezuela, RBVietnamWorldYemen, Rep.ZambiaZimbabwe Timeline:
This timeline shows a graph from 1961 to 2015 of World. No data until 1960. Number of actual observations by date: 55.
Source name:
World Development Indicators
Source organization:
World Bank staff estimates based data from International Monetary Fund's Direction of Trade database.
Categories, topics:
Private Sector, Trade
Last updated:
apr 23, 2017
Indicators value changes by year
Minimum:
106.533 bln
jan 1, 1961
Maximum:
18.867 trl
jan 1, 2015
At the date of observation
Value
Absolute change
Change from previous value
jan 1, 1961
106.533 bln
+106.533 bln
0.0%
jan 1, 1962
111.916 bln
+5.383 bln
5.05%
jan 1, 1963
117.744 bln
+5.828 bln
5.21%
jan 1, 1964
129.008 bln
+11.264 bln
9.57%
jan 1, 1965
145.909 bln
+16.901 bln
13.1%
jan 1, 1966
158.094 bln
+12.185 bln
8.35%
jan 1, 1967
176.378 bln
+18.285 bln
11.57%
jan 1, 1968
186.561 bln
+10.183 bln
5.77%
jan 1, 1969
211.46 bln
+24.899 bln
13.35%
jan 1, 1970
241.215 bln
+29.756 bln
14.07%
jan 1, 1971
279.844 bln
+38.629 bln
16.01%
jan 1, 1972
311.732 bln
+31.887 bln
11.39%
jan 1, 1973
368.437 bln
+56.705 bln
18.19%
jan 1, 1974
512.8 bln
+144.363 bln
39.18%
jan 1, 1975
747.224 bln
+234.425 bln
45.71%
jan 1, 1976
778.27 bln
+31.046 bln
4.15%
jan 1, 1977
883.544 bln
+105.274 bln
13.53%
jan 1, 1978
1.016 trl
+132.653 bln
15.01%
jan 1, 1979
1.181 trl
+164.593 bln
16.2%
jan 1, 1980
1.478 trl
+297.491 bln
25.19%
jan 1, 1981
1.785 trl
+306.753 bln
20.75%
jan 1, 1982
1.819 trl
+34.414 bln
1.93%
jan 1, 1983
1.702 trl
-117.092 bln
-6.44%
jan 1, 1984
1.655 trl
-47.579 bln
-2.79%
jan 1, 1985
1.766 trl
+111.264 bln
6.72%
jan 1, 1986
1.81 trl
+44.14 bln
2.5%
jan 1, 1987
1.967 trl
+157.163 bln
8.68%
jan 1, 1988
2.303 trl
+335.229 bln
17.04%
jan 1, 1989
2.642 trl
+339.744 bln
14.75%
jan 1, 1990
2.865 trl
+222.384 bln
8.42%
jan 1, 1991
3.277 trl
+412.445 bln
14.4%
jan 1, 1992
3.41 trl
+133.104 bln
4.06%
jan 1, 1993
3.699 trl
+288.946 bln
8.47%
jan 1, 1994
3.649 trl
-50.436 bln
-1.36%
jan 1, 1995
4.154 trl
+505.006 bln
13.84%
jan 1, 1996
4.943 trl
+789.407 bln
19.0%
jan 1, 1997
5.181 trl
+238.155 bln
4.82%
jan 1, 1998
5.559 trl
+377.9 bln
7.29%
jan 1, 1999
5.517 trl
-42.136 bln
-0.76%
jan 1, 2000
5.814 trl
+297.288 bln
5.39%
jan 1, 2001
6.587 trl
+772.374 bln
13.28%
jan 1, 2002
6.361 trl
-225.969 bln
-3.43%
jan 1, 2003
6.606 trl
+245.587 bln
3.86%
jan 1, 2004
7.718 trl
+1.112 trl
16.83%
jan 1, 2005
9.439 trl
+1.72 trl
22.29%
jan 1, 2006
10.77 trl
+1.331 trl
14.1%
jan 1, 2007
12.387 trl
+1.617 trl
15.01%
jan 1, 2008
14.302 trl
+1.915 trl
15.46%
jan 1, 2009
16.54 trl
+2.238 trl
15.65%
jan 1, 2010
12.746 trl
-3.794 trl
-22.94%
jan 1, 2011
15.381 trl
+2.636 trl
20.68%
jan 1, 2012
18.325 trl
+2.944 trl
19.14%
jan 1, 2013
18.423 trl
+98.463 bln
0.54%
jan 1, 2014
18.688 trl
+264.716 bln
1.44%
jan 1, 2015
18.867 trl
+179.269 bln
0.96%
Ranking of countries by current statistics by years


Comments: