29
/
en
AIzaSyAYiBZKx7MnpbEhh9jyipgxe19OcubqV5w
April 1, 2024
266002
Tonga
TON
true
2
1
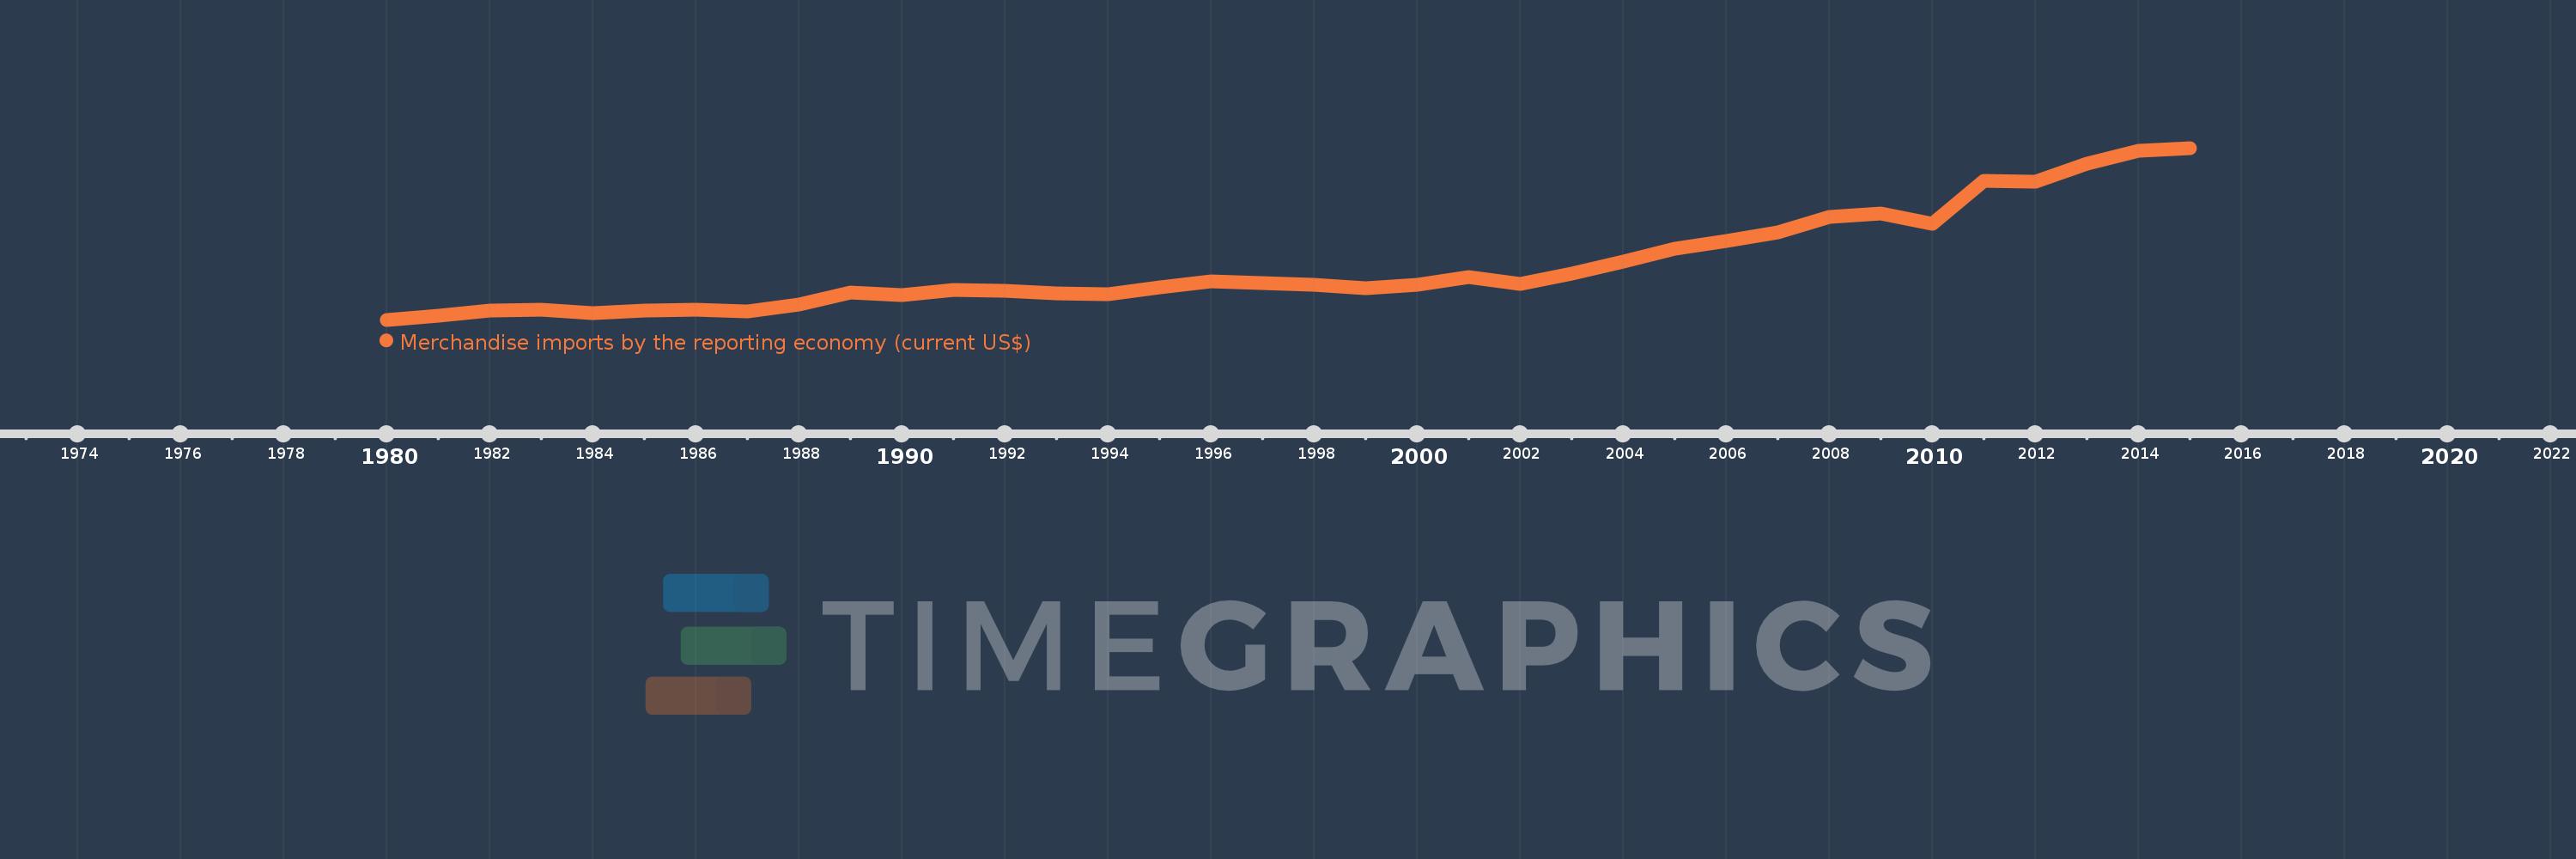
Merchandise imports by the reporting economy (current US$)
2015,2014,2013,2012,2011,2010,2009,2008,2007,2006,2005,2004,2003,2002,2001,2000,1999,1998,1997,1996,1995,1994,1993,1992,1991,1990,1989,1988,1987,1986,1985,1984,1983,1982,1981,1980
This statistics in other country:
AfghanistanAlbaniaAlgeriaAmerican SamoaAngolaAntigua and BarbudaArab WorldArgentinaArmeniaArubaAustraliaAustriaAzerbaijanBahamas, TheBahrainBangladeshBarbadosBelarusBelgiumBelizeBeninBermudaBoliviaBosnia and HerzegovinaBrazilBrunei DarussalamBulgariaBurkina FasoBurundiCabo VerdeCambodiaCameroonCanadaCaribbean small statesCentral African RepublicCentral Europe and the BalticsChadChileChinaColombiaComorosCongo, Dem. Rep.Congo, Rep.Costa RicaCote d'IvoireCroatiaCubaCyprusCzech RepublicDenmarkDjiboutiDominicaDominican RepublicEarly-demographic dividendEast Asia & PacificEast Asia & Pacific (excluding high income)East Asia & Pacific (IDA & IBRD countries)EcuadorEgypt, Arab Rep.El SalvadorEquatorial GuineaEstoniaEthiopiaEuro areaEurope & Central AsiaEurope & Central Asia (excluding high income)Europe & Central Asia (IDA & IBRD countries)European UnionFaroe IslandsFijiFinlandFragile and conflict affected situationsFranceFrench PolynesiaGabonGambia, TheGeorgiaGermanyGhanaGibraltarGreeceGreenlandGrenadaGuamGuatemalaGuineaGuinea-BissauGuyanaHaitiHeavily indebted poor countries (HIPC)High incomeHondurasHong Kong SAR, ChinaHungaryIBRD onlyIcelandIDA & IBRD totalIDA blendIDA onlyIDA totalIndiaIndonesiaIran, Islamic Rep.IraqIrelandIsraelItalyJamaicaJapanJordanKazakhstanKenyaKiribatiKorea, Dem. People’s Rep.Korea, Rep.KosovoKuwaitKyrgyz RepublicLao PDRLate-demographic dividendLatin America & Caribbean Latin America & Caribbean (excluding high income)Latin America & the Caribbean (IDA & IBRD countries)LatviaLeast developed countries: UN classificationLebanonLiberiaLibyaLithuaniaLow & middle incomeLow incomeLower middle incomeLuxembourgMacao SAR, ChinaMacedonia, FYRMadagascarMalawiMalaysiaMaldivesMaliMaltaMauritaniaMauritiusMexicoMiddle East & North AfricaMiddle East & North Africa (excluding high income)Middle East & North Africa (IDA & IBRD countries)Middle incomeMoldovaMongoliaMontenegroMoroccoMozambiqueMyanmarNauruNepalNetherlandsNew CaledoniaNew ZealandNicaraguaNigerNigeriaNorth AmericaNorwayOECD membersOmanOther small statesPacific island small statesPakistanPanamaPapua New GuineaParaguayPeruPhilippinesPolandPortugalPost-demographic dividendPre-demographic dividendQatarRomaniaRussian FederationRwandaSamoaSao Tome and PrincipeSaudi ArabiaSenegalSerbiaSeychellesSierra LeoneSingaporeSlovak RepublicSloveniaSmall statesSolomon IslandsSomaliaSouth AfricaSouth AsiaSouth Asia (IDA & IBRD)SpainSri LankaSt. Kitts and NevisSt. LuciaSt. Vincent and the GrenadinesSub-Saharan Africa Sub-Saharan Africa (excluding high income)Sub-Saharan Africa (IDA & IBRD countries)SudanSurinameSwedenSwitzerlandSyrian Arab RepublicTajikistanTanzaniaThailandTogoTongaTrinidad and TobagoTunisiaTurkeyTurkmenistanTuvaluUgandaUkraineUnited Arab EmiratesUnited KingdomUnited StatesUpper middle incomeUruguayUzbekistanVanuatuVenezuela, RBVietnamWorldYemen, Rep.ZambiaZimbabwe Timeline:
This timeline shows a graph from 1980 to 2015 of Tonga. No data until 1979. Number of actual observations by date: 36.
Source name:
World Development Indicators
Source organization:
World Bank staff estimates based data from International Monetary Fund's Direction of Trade database.
Categories, topics:
Private Sector, Trade
Last updated:
apr 23, 2017
Indicators value changes by year
Minimum:
29.299 mln
jan 1, 1980
Maximum:
243.908 mln
jan 1, 2015
At the date of observation
Value
Absolute change
Change from previous value
jan 1, 1980
29.299 mln
+29.299 mln
0.0%
jan 1, 1981
34.313 mln
+5.014 mln
17.11%
jan 1, 1982
40.324 mln
+6.011 mln
17.52%
jan 1, 1983
41.801 mln
+1.477 mln
3.66%
jan 1, 1984
37.533 mln
-4.268 mln
-10.21%
jan 1, 1985
41.224 mln
+3.691 mln
9.83%
jan 1, 1986
41.356 mln
+132.0K
0.32%
jan 1, 1987
39.856 mln
-1.5 mln
-3.63%
jan 1, 1988
47.946 mln
+8.09 mln
20.3%
jan 1, 1989
62.968 mln
+15.022 mln
31.33%
jan 1, 1990
59.695 mln
-3.273 mln
-5.2%
jan 1, 1991
66.934 mln
+7.239 mln
12.13%
jan 1, 1992
65.617 mln
-1.317 mln
-1.97%
jan 1, 1993
62.556 mln
-3.06 mln
-4.66%
jan 1, 1994
61.611 mln
-945.128K
-1.51%
jan 1, 1995
69.275 mln
+7.664 mln
12.44%
jan 1, 1996
77.316 mln
+8.041 mln
11.61%
jan 1, 1997
74.663 mln
-2.653 mln
-3.43%
jan 1, 1998
72.721 mln
-1.942 mln
-2.6%
jan 1, 1999
68.788 mln
-3.934 mln
-5.41%
jan 1, 2000
72.832 mln
+4.044 mln
5.88%
jan 1, 2001
82.703 mln
+9.871 mln
13.55%
jan 1, 2002
73.883 mln
-8.82 mln
-10.66%
jan 1, 2003
87.06 mln
+13.177 mln
17.83%
jan 1, 2004
101.467 mln
+14.408 mln
16.55%
jan 1, 2005
117.746 mln
+16.279 mln
16.04%
jan 1, 2006
127.777 mln
+10.031 mln
8.52%
jan 1, 2007
138.9 mln
+11.123 mln
8.71%
jan 1, 2008
157.264 mln
+18.364 mln
13.22%
jan 1, 2009
161.767 mln
+4.502 mln
2.86%
jan 1, 2010
149.347 mln
-12.42 mln
-7.68%
jan 1, 2011
202.683 mln
+53.336 mln
35.71%
jan 1, 2012
202.22 mln
-462.983K
-0.23%
jan 1, 2013
223.877 mln
+21.656 mln
10.71%
jan 1, 2014
239.936 mln
+16.059 mln
7.17%
jan 1, 2015
243.908 mln
+3.972 mln
1.66%
Ranking of countries by current statistics by years


Comments: